. 2010 Jul;153(3):915-24.
doi: 10.1104/pp.110.155713. Epub 2010 May 4.

Quantifying the labeling and the levels of plant cell wall precursors using ion chromatography tandem mass spectrometry

Affiliations

Quantifying the labeling and the levels of plant cell wall precursors using ion chromatography tandem mass spectrometry

Ana P Alonso et al. Plant Physiol. 2010 Jul.

Abstract

The biosynthesis of cell wall polymers involves enormous fluxes through central metabolism that are not fully delineated and whose regulation is poorly understood. We have established and validated a liquid chromatography tandem mass spectrometry method using multiple reaction monitoring mode to separate and quantify the levels of plant cell wall precursors. Target analytes were identified by their parent/daughter ions and retention times. The method allows the quantification of precursors at low picomole quantities with linear responses up to the nanomole quantity range. When applying the technique to Arabidopsis (Arabidopsis thaliana) T87 cell cultures, 16 hexose-phosphates (hexose-Ps) and nucleotide-sugars (NDP-sugars) involved in cell wall biosynthesis were separately quantified. Using hexose-P and NDP-sugar standards, we have shown that hot water extraction allows good recovery of the target metabolites (over 86%). This method is applicable to quantifying the levels of hexose-Ps and NDP-sugars in different plant tissues, such as Arabidopsis T87 cells in culture and fenugreek (Trigonella foenum-graecum) endosperm tissue, showing higher levels of galacto-mannan precursors in fenugreek endosperm. In Arabidopsis cells incubated with [U-(13)C(Fru)]sucrose, the method was used to track the labeling pattern in cell wall precursors. As the fragmentation of hexose-Ps and NDP-sugars results in high yields of [PO(3)](-)/or [H(2)PO(4)](-) ions, mass isotopomers can be quantified directly from the intensity of selected tandem mass spectrometry transitions. The ability to directly measure (13)C labeling in cell wall precursors makes possible metabolic flux analysis of cell wall biosynthesis based on dynamic labeling experiments.


Figures

Figure 1.
Figure 1.
The metabolic network of cell wall precursors. The metabolic network of cell wall precursors is presented in black. NDP-sugars are used to build sugar residues into wall polysaccharides (brick pattern). The pathways presented in green produce or use cell wall precursors for other metabolic processes. Abbreviations not defined in text: 6PG, 6-phosphogluconic acid; bP, bisphosphate; E4P, erythrose 4-P; P5P, pentose-5-P; S7P, sedoheptulose-7-P; TP, triose-P.
Figure 2.
Figure 2.
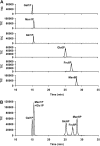
Analyses of hexose-P standards by LC-MS/MS. Hexose-P standards, approximately 10 μm each, were monitored by LC-MS/MS at the transition 259/97 using the separation and hardware described in “Materials and Methods.” A, TIC of hexose-P standards injected individually. B, TIC of the mixture of hexose-P standards.
Figure 3.
Figure 3.
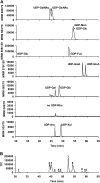
LC-MS/MS analyses of NDP-sugar standards. NDP-sugar standards, approximately 100 μm each with the exception of UDP-Api and UDP-Rha, which are not commercially available, were analyzed by LC-MS/MS using the separation and hardware described in “Materials and Methods.” A, At different transitions; tr606/79 for UDP-GalNAc and UDP-GlcNAc, tr604/79 for GDP-Man and GDP-Glc, tr588/159 for ADP-Glc and GDP-Fuc, tr579/159 for UDP-GlcA and UDP-GalA, tr565/79 for UDP-Gal and UDP-Glc, tr549/79 for UDP-Rha, tr535/79 for UDP-Ara, UDP-Xyl, and UDP-Api. B, TIC of the mixture of NDP-sugars standards. The assigned peaks are: 1, ADP-Glc; 2, UDP-GalNAc; 3, UDP-GlcNAc; 4, UDP-Ara + UDP-Gal; 5, UDP-Glc; 6, UDP-Xyl; 7, GDP-Fuc; 8, GDP-Man + GDP-Glc; 9, UDP-GalA; 10, UDP-GlcA.
Figure 4.
Figure 4.
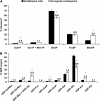
Cell wall precursor composition in Arabidopsis cells and fenugreek endosperms. Arabidopsis T87 cell suspension culture and fenu-greek endosperms were sampled as described in “Materials and Methods.” Intracellular metabolites were extracted in boiling water, filtered, and concentrated before being analyzed by LC-MS/MS using the separation and hardware described in “Materials and Methods.” A and B, Hexose-P composition (A) and NDP-sugar composition (B) in Arabidopsis T87 cells in culture (black bars, mean ± sd, n = 3 biological replicates) and fenugreek endosperms 25 d after flowering (white bars, mean ± sd, n = 3 biological replicates). For each compound the asterisk (*) means that there is a significant difference at the P < 0.05 level (Tukey's studentized range test) between Arabidopsis cells and fenugreek endosperms.
Figure 5.
Figure 5.
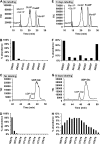
MRM application to steady-state 13C-labeling analysis of Fru6P and UDP-Glc. Arabidopsis cells were grown in medium containing 100% [U-13CFru]Suc until isotopic steady state was reached. Phosphorylated metabolites were extracted as previously described and analyzed by LC-MS/MS. The selected daughter ions are [H2PO4] (m/z = 97) for Fru6P and [PO3] (m/z = 79) for UDP-Glc. For a phosphorylated metabolite containing n atoms of carbon, we follow n + 1 transitions: [M0-H]/97, [M+1-H]/97…[M+n-H]/97. A, TIC of the transitions 259/97 through 265/97 before labeling. B, Mass isotopomer distribution of Fru6P before labeling. C, TIC of the transitions 565/79 through 580/79 before labeling. D, Mass isotopomer distribution of UDP-Glc before labeling. E, TIC of the transitions 259/97 through 265/97 after 6 d of labeling. F, Mass isotopomer distribution of Fru6P after 6 d of labeling. G, TIC of the transitions 565/79 through 580/79 after 6 d of labeling. H, Mass isotopomer distribution of UDP-Glc after 6 d of labeling.
Figure 6.
Figure 6.
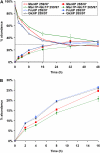
MRM application to pulse C-labeling analysis of hexose-Ps. Arabidopsis cells were labeled with 100% [U-13CFru]Suc. For each time point, 3 mL of cell suspension culture were sampled by filtration, and the phosphorylated metabolites were extracted in boiling water and analyzed by LC-MS/MS as described in “Materials and Methods.” The selected daughter ions are [H2PO4] (m/z = 97) and we followed the transitions 259/97 through 265/97, corresponding to the hexose-Ps. Empty blue circles, black triangles, red squares, and green diamonds represent the relative abundance of unlabeled Fru6P, Glc6P, Man6P, and Man1P + Glc1P, respectively. The filled blue circles, black triangles, red squares, and green diamonds represent the relative abundance of fully labeled Fru6P, Glc6P, Man6P, and Man1P + Glc1P, respectively. Error bars represent sd of three biological replicates. B is a magnification of region framed in A.

References

    1. Allwood JW, Goodacre R. (2010) An introduction to liquid chromatography-mass spectrometry instrumentation applied in plant metabolomic analyses. Phytochem Anal 21: 33–47 - PubMed
    1. Arrivault S, Guenther M, Ivakov A, Feil R, Vosloh D, van Dongen JT, Sulpice R, Stitt M. (2009) Use of reverse-phase liquid chromatography, linked to tandem mass spectrometry, to profile the Calvin cycle and other metabolic intermediates in Arabidopsis rosettes at different carbon dioxide concentrations. Plant J 59: 824–839 - PubMed
    1. Bajad SU, Lu W, Kimball EH, Yuan J, Peterson C, Rabinowitz JD. (2006) Separation and quantification of water soluble cellular metabolites by hydrophilic interaction chromatography-tandem mass spectrometry. J Chromatogr A 1125: 76–88 - PubMed
    1. Canelas AB, ten Pierick A, Ras C, Seifar RM, van Dam JC, van Gulik WM, Heijnen JJ. (2009) Quantitative evaluation of intracellular metabolite extraction techniques for yeast metabolomics. Anal Chem 81: 7379–7389 - PubMed
    1. Cruz JA, Emery C, Wüst M, Kramer DM, Lange BM. (2008) Metabolite profiling of Calvin cycle intermediates by HPLC-MS using mixed-mode stationary phases. Plant J 55: 1047–1060 - PubMed

Publication types