. 2010 May;9(5):1080-91.
doi: 10.1158/1535-7163.MCT-09-0965. Epub 2010 May 4.

mRNA and microRNA expression profiles of the NCI-60 integrated with drug activities

Affiliations

mRNA and microRNA expression profiles of the NCI-60 integrated with drug activities

Hongfang Liu et al. Mol Cancer Ther. 2010 May.

Abstract

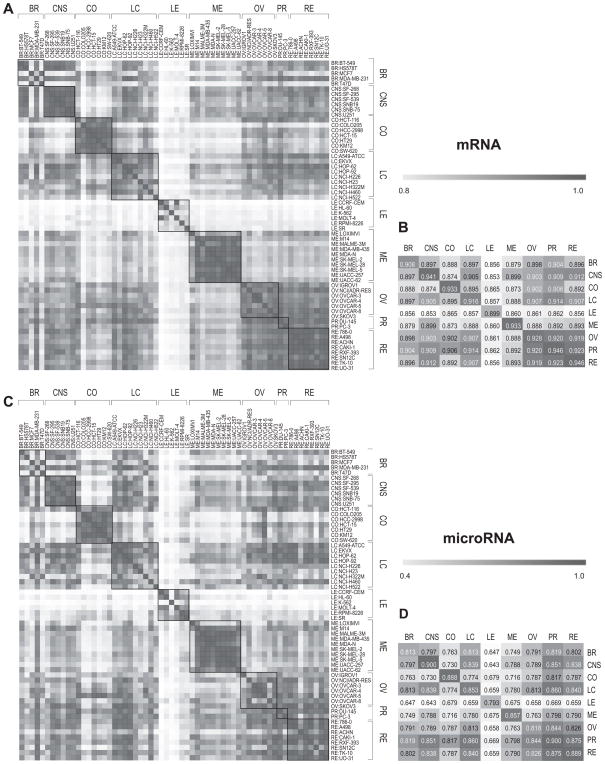
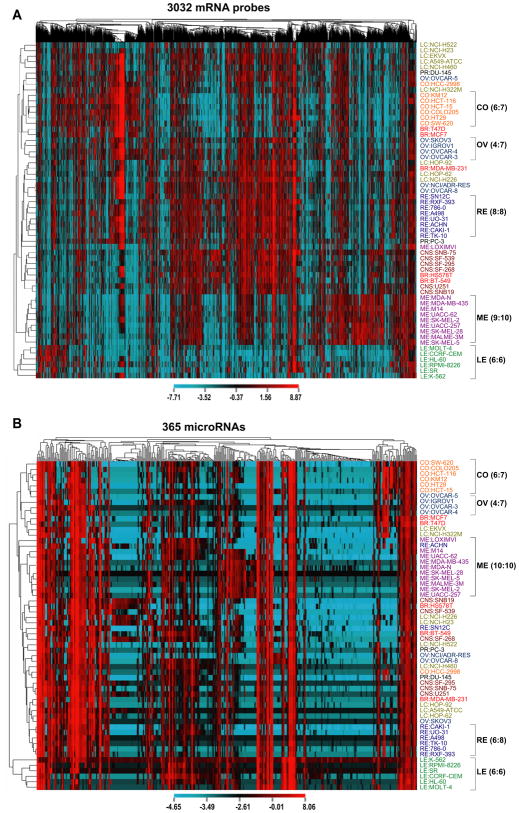
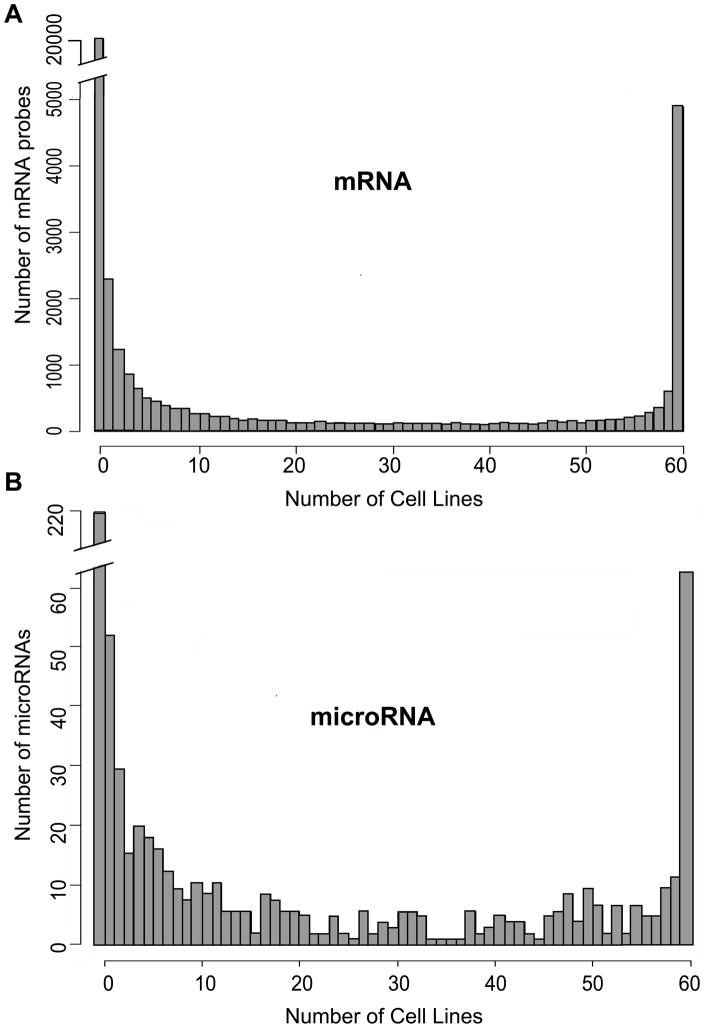
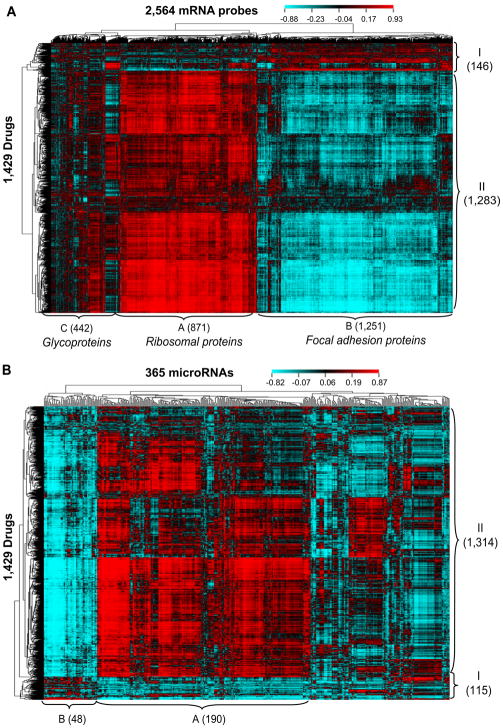
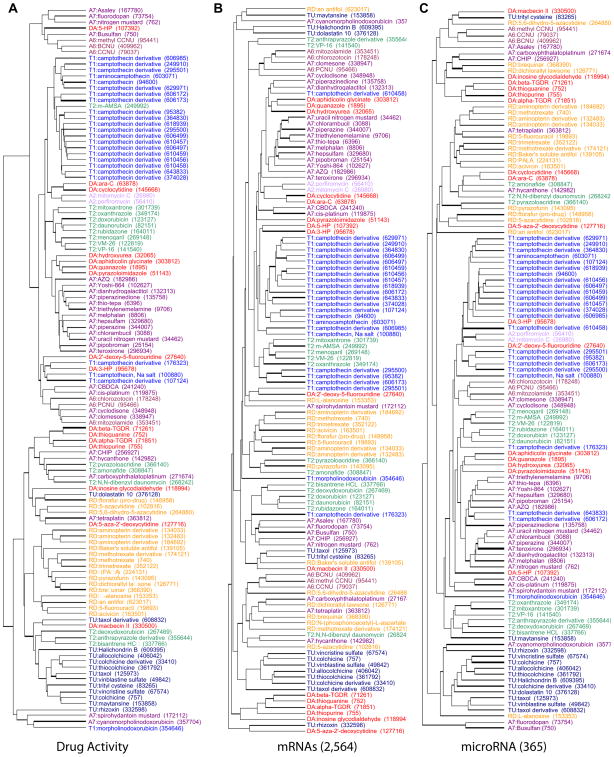
As part of the Spotlight on Molecular Profiling series, we present here new profiling studies of mRNA and microRNA expression for the 60 cell lines of the National Cancer Institute (NCI) Developmental Therapeutics program (DTP) drug screen (NCI-60) using the 41,000-probe Agilent Whole Human Genome Oligo Microarray and the 15,000-feature Agilent Human microRNA Microarray V2. The expression levels of approximately 21,000 genes and 723 human microRNAs were measured. These profiling studies include quadruplicate technical replicates for six and eight cell lines for mRNA and microRNA, respectively, and duplicates for the remaining cell lines. The resulting data sets are freely available and searchable online in our CellMiner database. The result indicates high reproducibility for both platforms and an essential biological similarity across the various cell types. The mRNA and microRNA expression levels were integrated with our previously published 1,429-compound database of anticancer activity obtained from the NCI DTP drug screen. Large blocks of both mRNAs and microRNAs were identified with predominately unidirectional correlations to approximately 1,300 drugs, including 121 drugs with known mechanisms of action. The data sets presented here will facilitate the identification of groups of mRNAs, microRNAs, and drugs that potentially affect and interact with one another.


Conflict of interest statement

No conflicts of interest to disclose.

Figures

Figure 1
Figure 1
Pearson correlation coefficients of expression levels of 41,000 mRNA probes and 365 microRNAs, organized by tissue of origin (not clustered) in the NCI-60. A. Heat map of correlation coefficients of replicates (diagonal) and cell-cell correlation coefficients for mRNA. B. Tissue-of-origin mean correlation coefficients for mRNA. C. Heat map of correlation coefficients of replicates (diagonal) and cell-cell correlation coefficients for microRNA. D. Tissue-of-origin mean correlation coefficients for microRNA. For the mRNA comparisons, all 41,000 probes were used; for the microRNA comparisons, the subset of 365 microRNAs expressed in at least 10% of the cell lines was used. In each case, all possible array cross-comparisons were done for the designated cell line or tissue-of-origin pairs. Averages were taken when there were multiple values.
Figure 2
Figure 2
Clustered image maps (CIMs) of mRNA and microRNA expression levels in the NCI-60. A. ClM of mRNA expression levels (X-axis) for 3,032 mRNA probes with both high and varied expression versus the NCI-60 cell lines (Y-axis). Selection was done as follows: for each probe (p), we first calculated max(p) and IQR(p) where max(p) is the maximum expression level of p across NCI-60 and IQR(p) is the interquartile range of expression level of P across NCI-60. The probes with both top-quartile max(p) value and the top-quartile IQR(p) values were selected to generate the CIM. Red indicates high expression and blue indicates low expression. B. CIM of 365 microRNA probe expression levels (X-axis) versus the NCI-60 (Y-axis). The microRNAs were selected according to the legend of Figure 1. Red indicates high expression and blue indicates low expression.
Figure 3
Figure 3
Histograms of mRNA and microRNA expression levels in the NCI-60. A. Histogram of the number of cell lines expressed with mRNA expression levels greater than or equal to 0 (i.e., with the top quartile expression level). B. Histogram of the number of cell lines (X-axis) in which a microRNA has detectable expression.
Figure 4
Figure 4
Clustered image maps (CIMs) of mRNA and microRNA expression levels versus drug activity in the NCI-60. A. CIM of the correlations of 2,564 mRNA expression levels (X-axis) versus 1,429 drug activities (Y-axis) for the NCI-60. Red color indicates high positive correlation and blue color indicates high negative correlation. The 2,566 mRNA probes were selected as having the 6.25% largest absolute correlations to the activities of the 1,429 drugs. B. CIM of the correlations of 365 microRNA expression levels (X-axis) versus 1,429 drug activities (Y-axis) in the NCI-60. Red color indicates high positive correlation and blue color indicates high negative correlation.
Figure 5
Figure 5
Dendograms of the set of 121 drugs with putatively known mechanisms of action. A. Clustering on the basis of the drug activity data alone. B. Clustering on the basis of correlations with the expression levels of 2,564 mRNAs from Figure 4A. C. Clustering on the basis of correlations with the expression levels of 365 microRNAs from Figure 4B. Color coding is by drug mechanism of action. Included are A2, A6, and A7 alkylating agents (alkylating at the N-2 position of guanine, alkylating at the O-6 position of guanine, and alkylating at the N-7 position of guanine, respectively), tubulin-active antimitotic agents (Tu), topoisomerase 1 inhibitors (T1), topoisomerase2 inhibitors (T2), DNA antimetobolites (DA), RNA/DNA antimetobolites (RD).

Similar articles

Cited by

References

    1. Jay C, Nemunaitis J, Chen P, Fulgham P, Tong AW. mi RNA Profiling for Diagnosis and Prognosis of Human Cancer. DNA and Cell Biology. 2007;26:293–300. - PubMed
    1. Carthew RW, Sontheimer EJ. Origins and Mechanisms of miRNAs and siRNAs. Cell. 2009;136:642–55. - PMC - PubMed
    1. Bartel DP. MicroRNAs: genomics, biogenesis, mechanism, and function. Cell. 2004;116:281–97. - PubMed
    1. Aravin A, Tuschl T. Identification and characterization of small RNAs involved in RNA silencing. FEBS Lett. 2005;579:5830–40. - PubMed
    1. Barad O, Meiri E, Avniel A, et al. MicroRNA expression detected by oligonucleotide microarrays: system establishment and expression profiling in human tissues. Genome Res. 2004;14:2486–94. - PMC - PubMed

Publication types

MeSH terms