Comparative Study
. 2010 May;9(5):1451-60.
doi: 10.1158/1535-7163.MCT-10-0106. Epub 2010 May 4.

Analysis of Food and Drug Administration-approved anticancer agents in the NCI60 panel of human tumor cell lines

Affiliations
Comparative Study

Analysis of Food and Drug Administration-approved anticancer agents in the NCI60 panel of human tumor cell lines

Susan L Holbeck et al. Mol Cancer Ther. 2010 May.

Erratum in

  • Correction.
    [No authors listed] [No authors listed] Am J Psychiatry. 2012 May;169(5):540. doi: 10.1176/appi.ajp.2012.169.5.540b. Am J Psychiatry. 2012. PMID: 22549216 Free PMC article. No abstract available.

Abstract

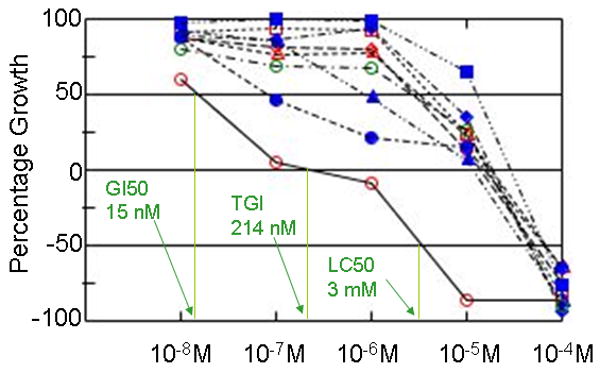
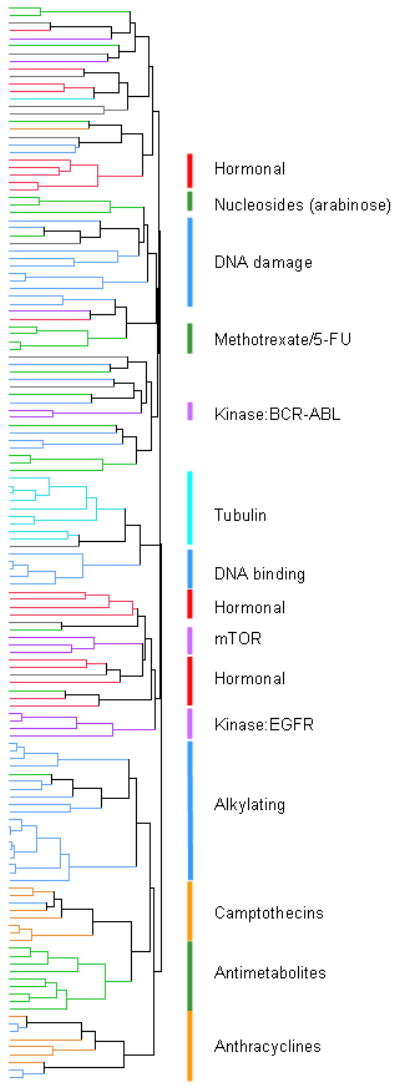
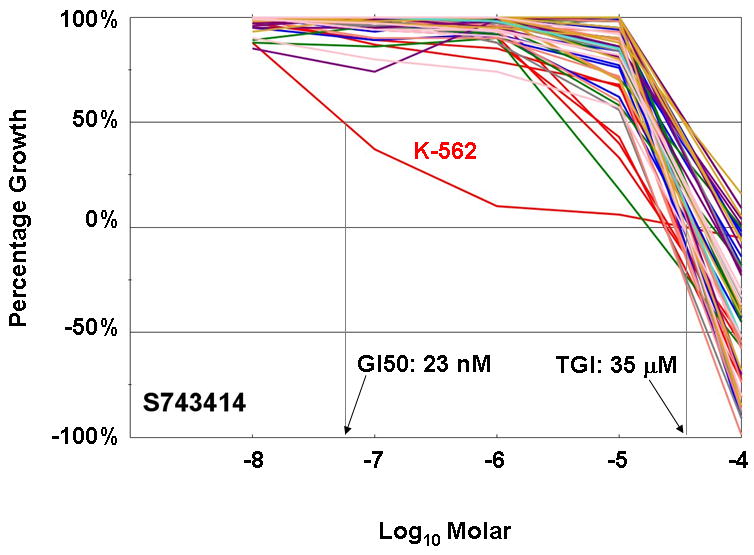
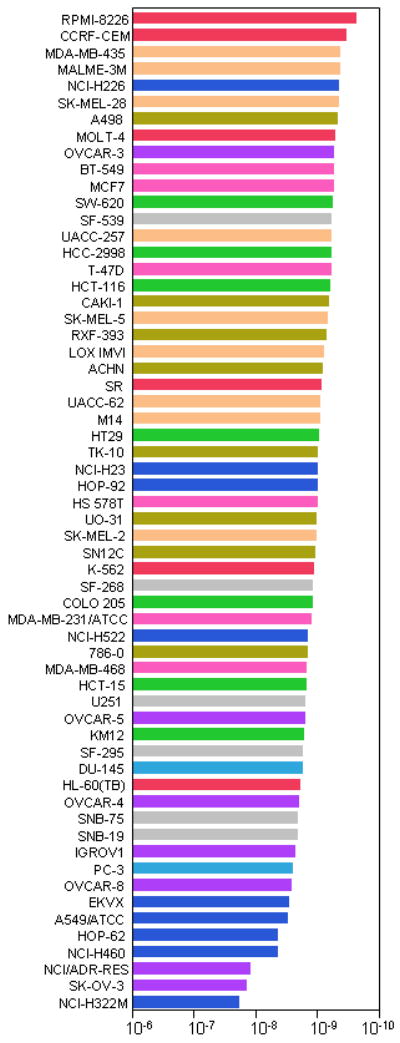
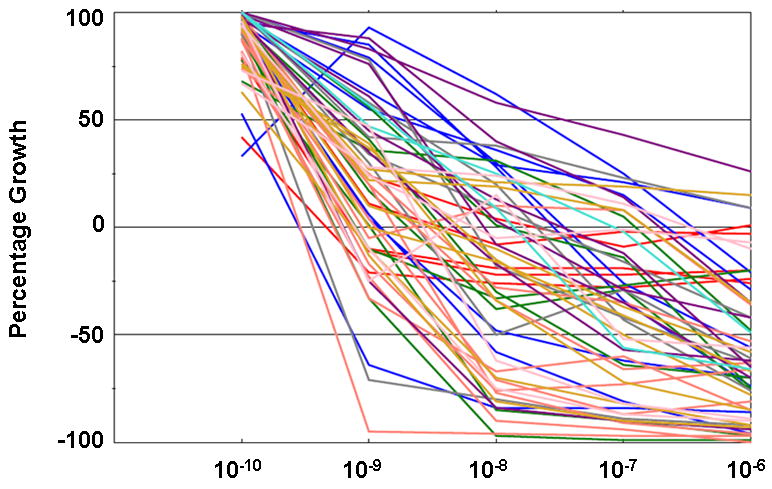
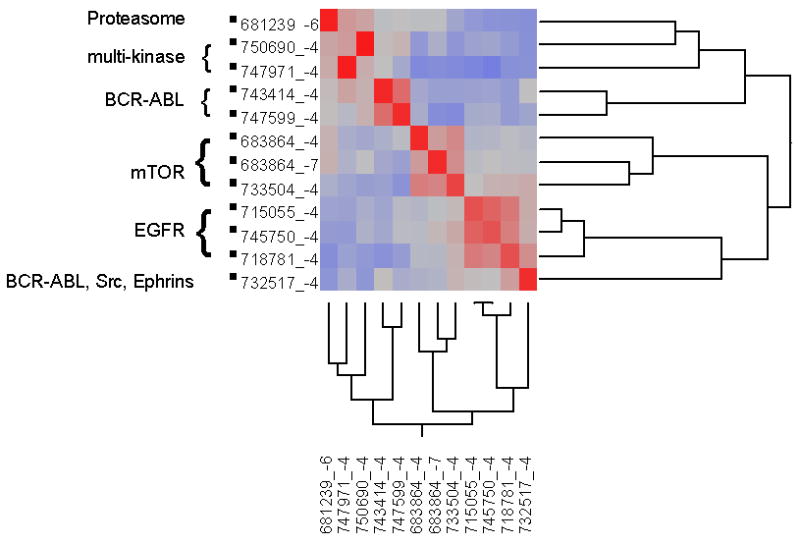
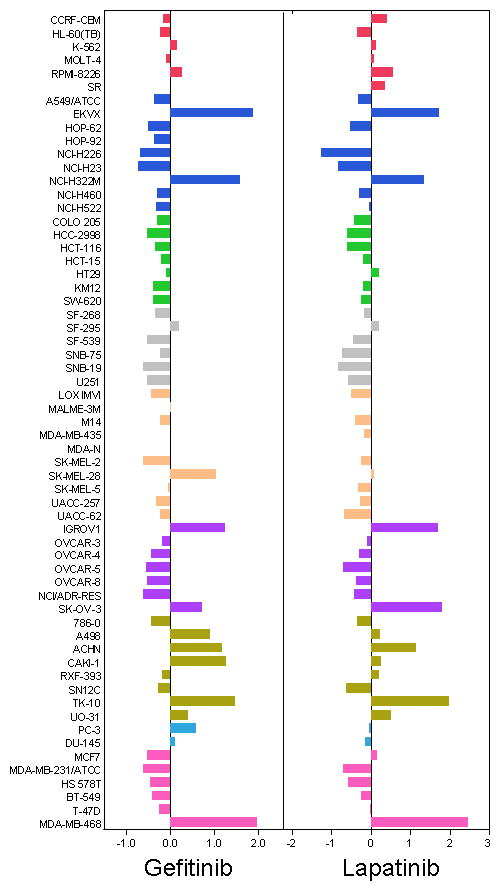
Since the early 1990s the Developmental Therapeutics Program of the National Cancer Institute (NCI) has utilized a panel of 60 human tumor cell lines (NCI60) representing 9 tissue types to screen for potential new anticancer agents. To date, about 100,000 compounds and 50,000 natural product extracts have been screened. Early in this program it was discovered that the pattern of growth inhibition in these cell lines was similar for compounds of similar mechanism. The development of the COMPARE algorithm provided a means by which investigators, starting with a compound of interest, could identify other compounds whose pattern of growth inhibition was similar. With extensive molecular characterization of these cell lines, COMPARE and other user-defined algorithms have been used to link patterns of molecular expression and drug sensitivity. We describe here the results of screening current Food and Drug Administration (FDA)-approved anticancer agents in the NCI60 screen, with an emphasis on those agents that target signal transduction. We analyzed results from agents with mechanisms of action presumed to be similar; we also carried out a hierarchical clustering of all of these agents. The addition of data from recently approved anticancer agents will increase the utility of the NCI60 databases to the cancer research community. These data are freely accessible to the public on the DTP website (http://dtp.cancer.gov/). The FDA-approved anticancer agents are themselves available from the NCI as a plated set of compounds for research use.


Conflict of interest statement

Conflicts of interest: None.

Figures

Figure 1
Figure 1. Dose-response graphs for dasatinib assayed in the melanoma panel, demonstrating endpoint calculations
Dasatinib (NSC 732517) was tested at 5 concentrations (1 log dilutions from 10-4M to 10-8M). Growth percent of 100 corresponds to growth seen in untreated cells. Growth percent of 0 indicates no net growth over the course of the assay (i.e. equal to the number of cells at time zero). Growth percent of -100 results when all cells are killed. Three endpoints are routinely calculated: 1) GI50, the log M concentration yielding a growth percent of 50 (i.e. 50% growth inhibition), 2) TGI, the log M concentration yielding a growth percent of 0, or Total Growth Inhibition, and 3) LC50, the log M concentration yielding a growth percent of -50, or lethality in 50% of the starting cells. These endpoints are illustrated for cell line LOX-IMVI (red open circle). Other cell lines displayed are Malme-3M (red open diamond), M14 (red open triangle), MDA-MB-435 (red open square), SK-MEL-2 (solid blue circle), SK-MEL-28 (solid blue diamond), SK-MEL-5 (solid blue triangle), UACC-257 (solid blue square) and UACC-62 (open green circle).
Figure 2
Figure 2. Clustering of correlations of NCI60 GI50 patterns for all drugs
Pearson correlation coefficients comparing the GI50 patterns of each drug to all other drugs were hierarchically clustered. The agents are color-coded according to mechanistic category: Purple for signaling agents, blue for alkylating and other DNA damaging agents, turquoise for tubulin binders, orange for topoisomerase poisons, green for antimetabolites and nucleosides, red for hormonal agents and grey for all others. The correlation underlying this clustering can be found in Supplemental Table 1, presented in the same sort order as this figure.
Figure 3
Figure 3. Dose response graphs for all cell lines in the NCI60 panel exposed to imatinib (NSC 743414)
Imatinib was tested at 5 concentrations (1 log dilutions from 10-4M to 10-8M). Note that only one of the cell lines, K-562, which harbors a BCR-Abl gene fusion, has significant sensitivity to this BCR-Abl/KIT/PDGFR inhibitor. The GI50 and TGI concentrations for K-562 are indicated. Imatinib did not cause sufficient lethality in this cell line to calculate LC50. The graph is color-coded by tissue of origin: Red for leukemia, blue for lung cancer, green for colon cancer, grey for CNS cancer, coral for melanoma, purple for ovarian cancer, gold for renal cancer, turquoise for prostate cancer and pink for breast cancer cell lines.
Figure 4
Figure 4. NCI60 graphs for bortezomib (NSC 681239)
The data for bortezomib tested at 5 concentrations (1 log dilutions from 10-6M to 10-10M) are presented in two different formats. Figure 4a: GI50 molar values presented as a “waterfall” plot, with the most sensitive cell lines for each endpoint at the top of the graph. Figure 4b: Dose-response curves for all cell lines overlaid on the same plot. Cell lines are color-coded as for Figure 3.
Figure 5
Figure 5. Clustering of correlations of NCI60 GI50 patterns for the signaling drugs
PCCs for the agents targeting signal transduction were hierarchically clustered in two symmetric dimensions. A heat map of the PCCs is shown, with higher correlations in red and lower PCCs in blue.
Figure 6
Figure 6. Mean graph plots of GI50 values for Gefitinib (NSC 715055) and Lapatinib (NSC 745750)
GI50 values for each cell line were calculated from dose-response curves. The mean GI50 for each compound across all 60 cell lines was calculated. The difference from the between the GI50 for a particular cell line and the mean GI50 is plotted here. Cell lines that were more sensitive are displayed as bars that project to the right of the mean. Cell lines that were less sensitive are displayed with bars projected to the left. Cell lines are color-coded as for Figure 3. Mean graphs for two compounds with similar mechanisms are shown. Both gefitinib and lapatinib inhibit the tyrosine kinase EGFR, and lapatinib also inhibits the related kinase ERBB2. The 2 compounds give similar mean graph patterns. The degree of similarity was quantitated using the COMPARE algorithm, which gave a Pearson correlation coefficient of 0.88, confirming that these patterns are very similar. The most responsive cell lines to these agents are all wild-type for KRAS, in line with what has been observed in the clinic.

References

    1. Cragg GM. Paclitaxel (Taxol): a success story with valuable lessons for natural product drug discovery and development. Med Res Rev. 1998 Sep;18(5):315–31. - PubMed
    1. Holbeck SL, Sausville EA. The Proteasome and the COMPARE Algorithm. In: Adams J, editor. Proteasome Inhibitors in Cancer Therapy. Humana Press; 2004.
    1. Scudiero DA, Shoemaker RH, Paull KD, et al. Evaluation of a soluble tetrazolium/formazan assay for cell growth and drug sensitivity in culture using human and other tumor cell lines. Cancer Res. 1988 Sep 1;48(17):4827–33. - PubMed
    1. Holbeck SL. Update on NCI in vitro drug screen utilities. Eur J Cancer. 2004 Apr;40(6):785–93. - PubMed
    1. Sausville EA, Holbeck SL. Transcription profiling of gene expression in drug discovery and development: the NCI experience. Eur J Cancer. 2004 Nov;40(17):2544–9. - PubMed

Publication types

MeSH terms

Substances