. 2010 Jul 16;285(29):22174-85.
doi: 10.1074/jbc.M109.085464. Epub 2010 May 4.

Adipocytokine orosomucoid integrates inflammatory and metabolic signals to preserve energy homeostasis by resolving immoderate inflammation

Affiliations

Adipocytokine orosomucoid integrates inflammatory and metabolic signals to preserve energy homeostasis by resolving immoderate inflammation

Yun Sok Lee et al. J Biol Chem. .

Abstract

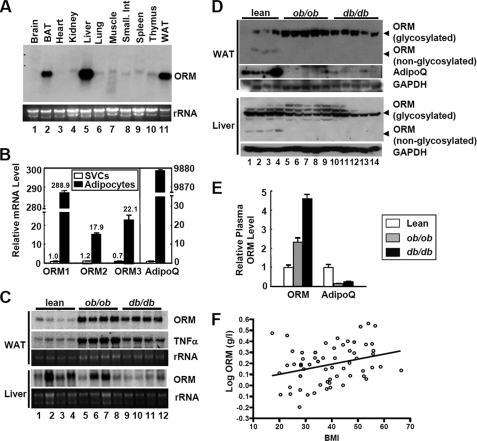
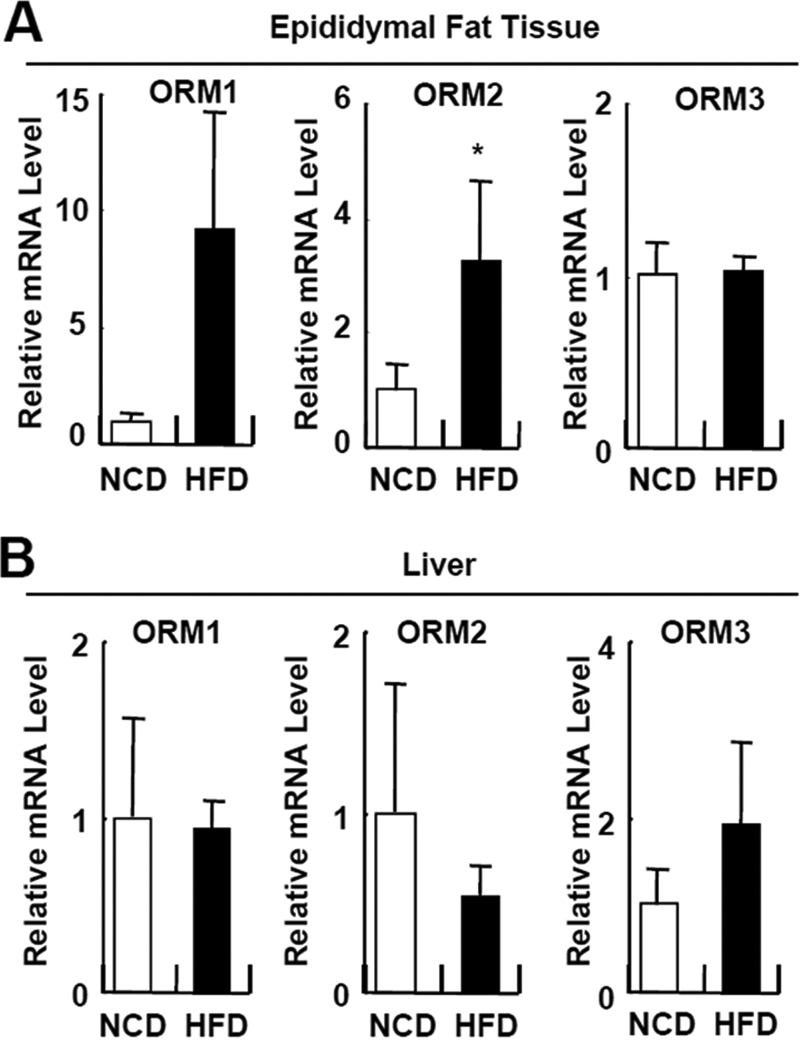
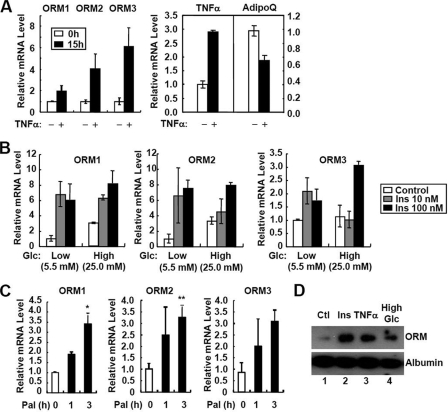
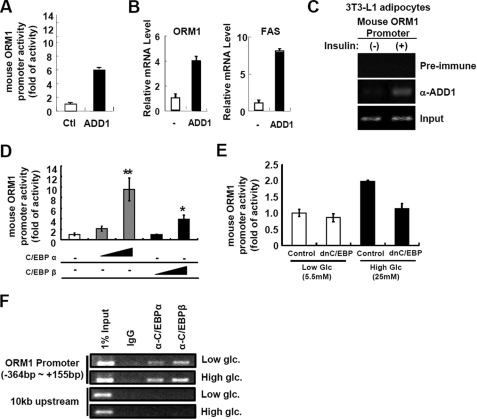
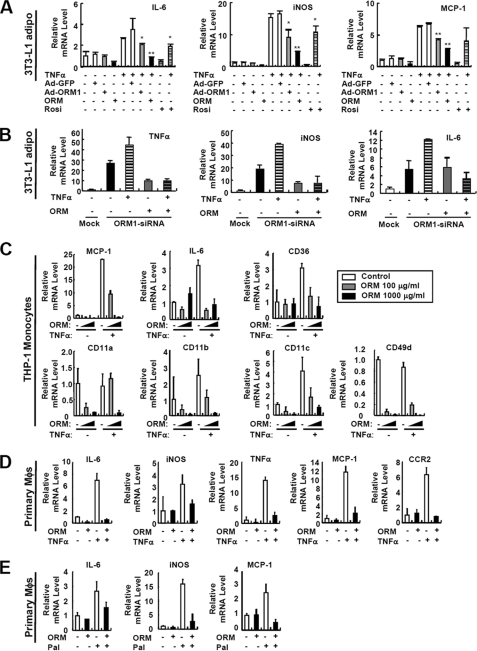
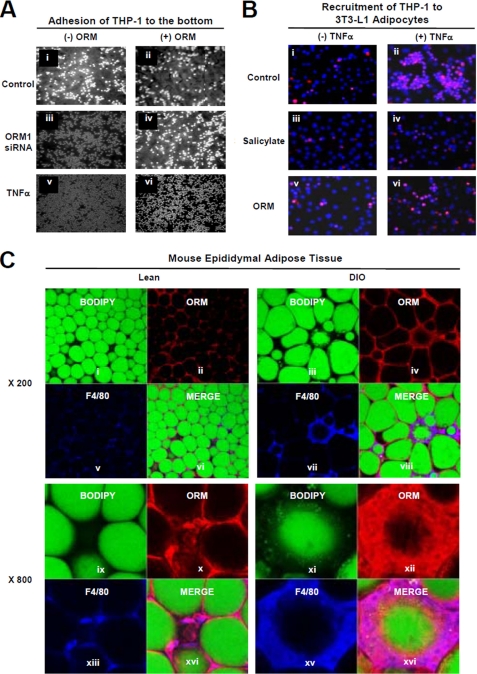
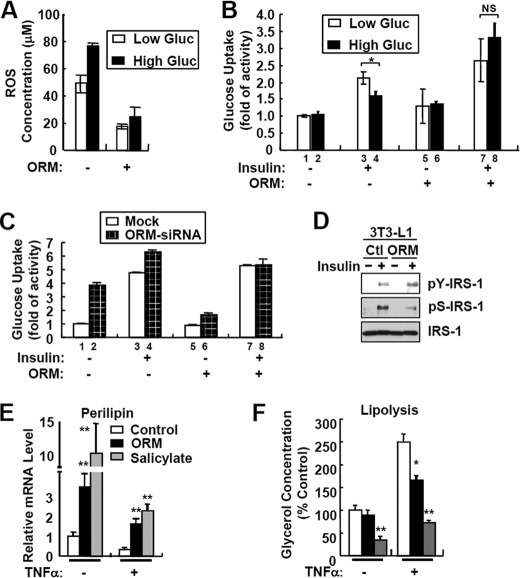
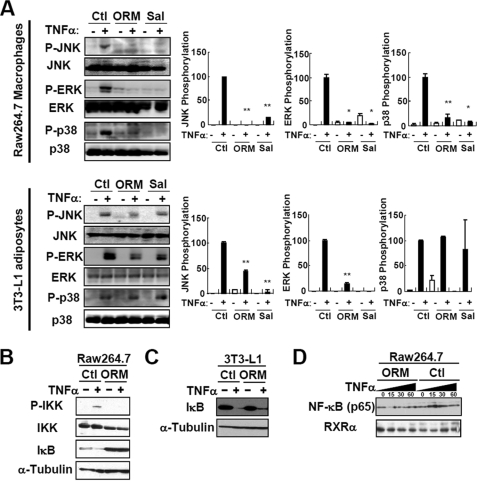
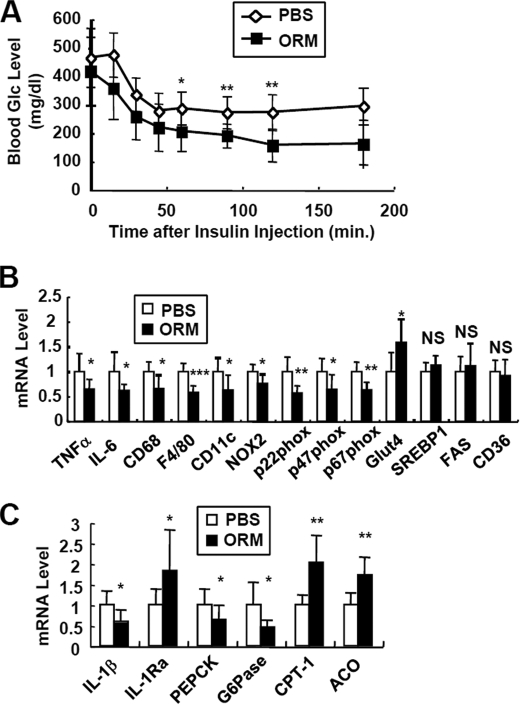
Orosomucoid (ORM), also called alpha-1 acid glycoprotein, is an abundant plasma protein that is an immunomodulator induced by stressful conditions such as infections. In this study, we reveal that Orm is induced selectively in the adipose tissue of obese mice to suppress excess inflammation that otherwise disturbs energy homeostasis. Adipose Orm levels were elevated by metabolic signals, including insulin, high glucose, and free fatty acid, as well as by the proinflammatory cytokine tumor necrosis factor-alpha, which is found in increased levels in the adipose tissue of morbid obese subjects. In both adipocytes and macrophages, ORM suppressed proinflammatory gene expression and pathways such as NF-kappaB and mitogen-activated protein kinase signalings and reactive oxygen species generation. Concomitantly, ORM relieved hyperglycemia-induced insulin resistance as well as tumor necrosis factor-alpha-mediated lipolysis in adipocytes. Accordingly, ORM improved glucose and insulin tolerance in obese and diabetic db/db mice. Taken together, our results suggest that ORM integrates inflammatory and metabolic signals to modulate immune responses to protect adipose tissue from excessive inflammation and thereby from metabolic dysfunction.


Figures

FIGURE 1.
FIGURE 1.
Orm is induced in the plasma and adipose tissues of obese subjects. A, Northern blot analysis of Orm expression in various mouse tissues. BAT, brown adipose tissue; WAT, white adipose tissue. B, mRNA levels of each Orm isoform in adipocytes and SVCs from epididymal adipose tissues of lean C57BL6 mice. Adiponectin (AdipoQ) was used as an adipocyte-specific marker gene. n = 4. C, Northern blot analysis of Orm expression in the liver and adipose tissue of obese ob/ob and db/db mice. D, Western blot analysis of ORM protein expression in the liver and adipose tissue. As ORMs are heavily glycosylated proteins (about 45% of their total mass is composed of carbohydrates), Western blot analysis of ORM with tissue samples accompanies both its glycosylated as well unglycosylated forms, as illustrated. GAPDH, glyceraldehyde-3-phosphate dehydrogenase. E, ORM protein level in the plasma of lean and obese mice. n = 4 or 5. F, correlation of plasma ORM level with body mass index (BMI). Serum ORM level was measured by enzyme-linked immunosorbent assay and plotted in accordance with body mass index. R = 0.3, p = 0.021.
FIGURE 2.
FIGURE 2.
Orm is induced selectively in adipose tissue upon HFD feeding. Q-PCR analysis of Orm expression in the epididymal adipose tissue (A) and liver (B) of C57BL6 mice fed with a normal chow diet (NCD; day 0) or HFD for 7 days. *, p < 0.05. n = 4 or 10.
FIGURE 3.
FIGURE 3.
Orm is induced by both proinflammatory and metabolic signals. A, TNFα induces the three Orm isoforms in 3T3-L1 adipocytes. Differentiated adipocytes were treated with TNFα (10 ng/ml) for 15 h. mRNA levels of each isoform of Orm, TNFα, and adiponectin (AdipoQ) were analyzed by Q-PCR. mRNA levels of TNFα and adiponectin (AdipoQ) were used as controls for the effect of TNFα. B, metabolic signals induce the three Orm isoforms. Differentiated adipocytes were preincubated in low glucose (Glc; 5.5 mm) media for 24 h and then treated with a series of concentrations of insulin (10 or 100 nm) in the presence or absence of high glucose (Glc; 25 mm) challenge. C, effect of palmitate (Pal; 500 μm) on Orm mRNA expression in 3T3-L1 adipocytes. D, secretion of ORM is promoted by metabolic and inflammatory signals in adipocytes. Differentiated adipocytes were preincubated in low glucose (Glc; 5.5 mm) containing DMEM supplemented with 0.2% bovine serum albumin. After 24 h, culture media were chased with fresh media, and the cells were treated with insulin (Ins; 100 nm), TNFα (10 ng/ml) or high glucose (25 mm) for additional 24 h. Secretion of ORM was evaluated by Western blot analysis with the cell-conditioned media. Ctl, control.
FIGURE 4.
FIGURE 4.
ADD1/SREBP1c and C/EBPs up-regulate Orm1 promoter activity in adipocytes. A, Orm1 promoter activity is enhanced by ADD1/SREBP1c. h293 cells were co-transfected with luciferase reporter containing Orm1 promoter and β-galactosidase DNA with or without ADD1/SREBP1c (ADD1; 100 ng) expression plasmid. 24 h after transfection, cells were harvested. Luciferase activities were measured and normalized by β-galactosidase activity. Ctl, control. B, in adipocytes, expression of Orm1 mRNA is stimulated by ADD1/SREBP1c. 3T3-L1 adipocytes were infected with mock (−) or ADD1/SREBP1c (ADD1) expressing adenovirus. 36 h after adenoviral infection, cells were harvested and subjected to Q-PCR analysis. FAS, fatty-acid synthase. C, insulin augments binding of ADD1/SREBP1c to the Orm1 promoter. 3T3-L1 adipocytes were incubated with or without insulin (100 nm) for 24 h and subjected to chromatin immunoprecipitation with preimmune serum or anti-ADD1/SREBP1c antibody. D, Orm1 promoter activity is stimulated by C/EBPα and C/EBPβ. h293 cells were co-transfected with luciferase reporter containing the Orm1 promoter and β-galactosidase DNA with or without C/EBPα (10 and 100 ng) or C/EBPβ (10 and 100 ng) expression plasmid. 24 h after transfection, cells were harvested. Luciferase activities were measured and normalized by β-galactosidase activity. *, p < 0.05; **, p < 0.01. E, high glucose-induced Orm1 promoter activity is suppressed by dominant negative C/EBP (dnC/EBP). h293 cells were co-transfected with the Orm1 promoter luciferase reporter and β-galactosidase with or without dominant negative C/EBPβ (500 ng) expression plasmid. 12 h after transfection, cells were incubated in low (5.5 mm) or high glucose (25 mm) media for additional 24 h and subjected to luciferase activity assays. F, high glucose condition promotes binding of C/EBPα and C/EBPβ to the Orm1 promoter in adipocytes. 3T3-L1 adipocytes were incubated in low (5.5 mm) and high glucose (25 mm) conditions for 24 h and subjected to chromatin immunoprecipitation assays using anti-C/EBPα or anti-C/EBPβ antibodies.
FIGURE 5.
FIGURE 5.
ORM suppresses inflammatory gene expression in adipocytes, monocytes, and macrophages. A, effect of ORM treatment and adenoviral overexpression of Orm1 in TNFα-induced inflammatory gene expression in 3T3-L1 adipocytes. Adenovirus-infected (50 multiplicities of infection, 2 days postinfection) or noninfected adipocytes were incubated with TNFα (10 ng/ml) in the presence or absence of ORM (250 μg/ml). Dose of ORM treatment was determined according to the circulating ORM level in normal mice. mRNA levels of inflammatory genes were analyzed by Q-PCR analysis. *, p < 0.05; **, p < 0.01. n = 2 or 3. iNOS, inducible nitric-oxide synthase; Rosi, rosiglitazone; IL-6, interleukin 6. B, knockdown of Orm1 induces inflammatory gene expression in 3T3-L1 adipocytes. 3T3-L1 stable cell lines overexpressing mock or mouse Orm1-specific siRNA were established by retroviral infection and following selection with puromycin. At day 7 of adipocyte differentiation, the cells were treated with TNFα (10 ng/ml) and/or ORM (250 μg/ml) for 24 h. mRNA levels of inflammatory genes were measured by Q-PCR analysis. C, ORM suppresses the expression of certain genes involved in inflammation and cell adhesion in THP-1 monocytes. THP-1 monocytes were incubated with TNFα (10 ng/ml) in the presence or absence of ORM (100 or 1000 μg/ml) for 6 h. mRNA levels of inflammatory genes were analyzed by Q-PCR analysis. D, ORM (250 μg/ml) suppresses TNFα-induced inflammatory gene expression in mouse peritoneal macrophages (Mϕs). E, ORM (250 μg/ml) suppresses palmitate (Pal)-induced inflammatory gene expression in mouse peritoneal macrophages.
FIGURE 6.
FIGURE 6.
ORM reduces interaction between adipocytes and macrophages. A, ORM suppresses the effect of adipocyte-conditioned media on adhesion of THP-1 monocytes to the bottom of culture dishes. Adipocyte-conditioned media were obtained from mock or Orm1 siRNA overexpressing 3T3-L1 adipocytes in the presence or absence of ORM (250 μg/ml) or TNFα (10 ng/ml) for 24 h. The adhesion of the THP-1 monocytes onto the bottom of the culture dish was photographed after incubating the cells in the adipocyte-conditioned media and washing them three times with PBS. B, ORM suppresses the recruitment of THP-1 monocytes to adipocytes. 3T3-L1 adipocytes and THP-1 monocytes were pretreated with or without ORM (250 μg/ml) or sodium salicylate (5 mm) for 24 h, and then the THP-1 monocytes were added to the upper chamber of the Transwell plates that contained the adipocytes and stimulated with TNFα. The recruitment of THP-1 cells to adipocytes was measured by immunostaining monocytes with an anti-CD68 antibody (red). C, ORM binds to macrophages in the adipose tissue. Epididymal adipose tissues from the lean (control) or DIO (fed HFD for 3 months) mice were immunostained with fluorescein isothiocyanate-conjugated BODIPY (green; adipocytes) or antibodies against ORM (red) or F4/80 (blue; macrophages) and whole-mounted for multiphoton fluorescence confocal microscopy.
FIGURE 7.
FIGURE 7.
ORM improves energy metabolism in adipocytes. A, 3T3-L1 adipocytes were incubated with low (5.5 mm) or high (25 mm) glucose (Gluc) media in the presence or absence of ORM (250 μg/ml) for 24 h. The levels of the accumulated ROS in adipocytes were measured by 5-(and -6)-chloromethyl-2′m7′-dichlorodihydrofluorescein diacetate, acetyl ester (CM-H2DCFDA) fluorescence staining. B, basal and insulin-dependent glucose uptake activity assay. 3T3-L1 adipocytes were incubated with low (5.5 mm) or high (25 mm) glucose media in the presence or absence of ORM (250 μg/ml) for 24 h. Glucose uptake activity was measured at 30 min after the insulin treatment. NS, not significant. C, suppression of Orm1 expression via siRNA impairs insulin sensitivity in adipocytes. 3T3-L1 cells stably expressing empty pSuper.retro (mock) or pSuper.retro-Orm1siRNA were differentiated into adipocytes. Mature adipocytes expressing mock or Orm1 siRNA were incubated with or without ORM (250 μg/ml) for 24 h. Glucose uptake activity was measured at 30 min after insulin treatment. D, ORM potentiates insulin signaling. 3T3-L1 adipocytes were serum-starved for 16 h in hyperglycemic condition (25 mm) and then treated with ORM (250 μg/ml) for 6 h. After 15 min of stimulation with insulin (10 nm), the cells were subjected to Western blot analysis. Ctl, control. E and F, 3T3-L1 adipocytes were pretreated with ORM (250 μg/ml, black bar) or sodium salicylate (5 mm, gray bar) in DMEM supplemented with 0.2% bovine serum albumin and then stimulated with TNFα (10 ng/ml) for a further 48 h. mRNA levels of perilipin were measured by Q-PCR analysis (E). Levels of lipolysis were determined by measuring glycerol concentration in the adipocyte-conditioned media (F). *, p < 0.05; **, p < 0.01. n = 3.
FIGURE 8.
FIGURE 8.
ORM suppresses MAPK and NF-κB activation in macrophages and adipocytes. A, RAW264.7 macrophages or 3T3-L1 adipocytes were pretreated with a vehicle, ORM (250 μg/ml), or sodium salicylate (Sal) (5 mm) for 6 h and then stimulated by TNFα (10 ng/ml) for a further 10 min. The levels of the phosphorylated and total MAPK proteins were measured by Western blot analysis. The results are representatives of at least three independent experiments. Ctl, control; *, p < 0.05; **, p < 0.01. n = 3. B and C, ORM suppresses IKK activation in macrophages (B) and adipocytes (C). D, ORM suppresses nuclear accumulation of NF-κB (p65) in macrophages. RAW264.7 macrophages were pretreated with a vehicle (ORM (250 μg/ml)) for 6 h, and then stimulated by TNFα (10 ng/ml) for a further 15, 30, or 60 min. The nuclear extract was prepared from the cells, and the protein level of p65 NF-κB was measured by Western blot analysis. RXRα, retinoid X receptor α.
FIGURE 9.
FIGURE 9.
In vivo effects of ORM in the obese and diabetic db/db mice. PBS (◇)-containing or ORM protein (■)-containing osmotic pumps were implanted in the db/db mice. The pumps released 0.34 μg/min purified ORM protein, which elevated the level of ORM up to 2-fold that of endogenous ORM. After 2 weeks, the mice were subjected to further analyses. A, insulin tolerance test. B, mRNA levels of inflammatory genes in epididymal adipose tissue of db/db mice with or without ORM treatment were measured by Q-PCR analysis. *, p < 0.05; **, p < 0.01; ***, p < 0.001. n = 6 or 8. NS, not significant; FAS, fatty-acid synthase. C, Q-PCR analysis of inflammatory and metabolic genes in the liver of the above mice. ACO, acyl-CoA oxidase. *, p < 0.05; **, p < 0.01. n = 6 or 8.

Similar articles

Cited by

References

    1. Lusis A. J. (2000) Nature 407, 233–241 - PMC - PubMed
    1. Hotamisligil G. S. (2006) Nature 444, 860–867 - PubMed
    1. Hotamisligil G. S., Shargill N. S., Spiegelman B. M. (1993) Science 259, 87–91 - PubMed
    1. Suganami T., Tanimoto-Koyama K., Nishida J., Itoh M., Yuan X., Mizuarai S., Kotani H., Yamaoka S., Miyake K., Aoe S., Kamei Y., Ogawa Y. (2007) Arterioscler. Thromb. Vasc. Biol. 27, 84–91 - PubMed
    1. Zhang H. H., Halbleib M., Ahmad F., Manganiello V. C., Greenberg A. S. (2002) Diabetes 51, 2929–2935 - PubMed

Publication types

MeSH terms