. 2010 Jul 9;285(28):21877-87.
doi: 10.1074/jbc.M109.066290. Epub 2010 May 4.

Generation of cyclic ADP-ribose and nicotinic acid adenine dinucleotide phosphate by CD38 for Ca2+ signaling in interleukin-8-treated lymphokine-activated killer cells

Affiliations

Generation of cyclic ADP-ribose and nicotinic acid adenine dinucleotide phosphate by CD38 for Ca2+ signaling in interleukin-8-treated lymphokine-activated killer cells

So-Young Rah et al. J Biol Chem. .

Abstract

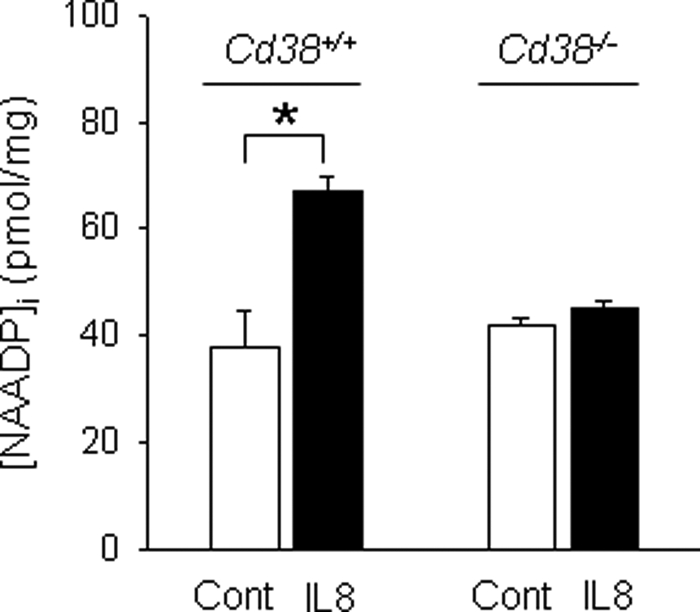
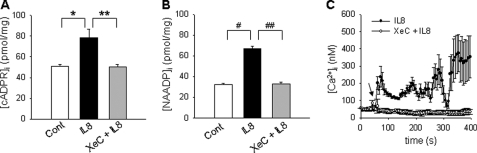
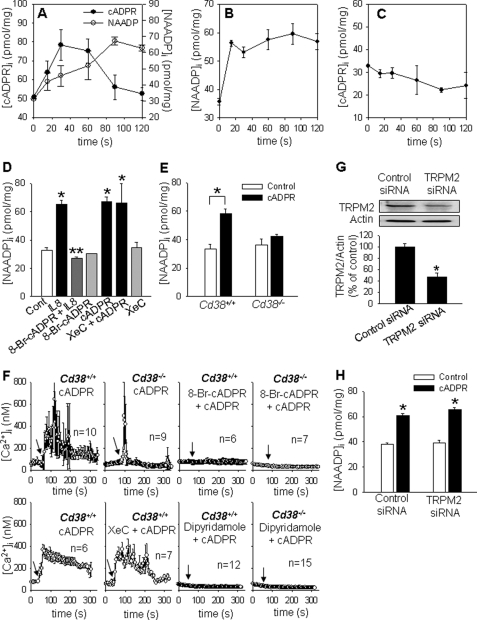
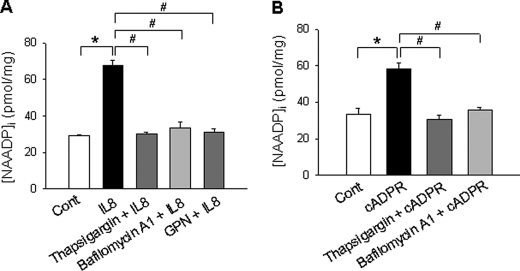
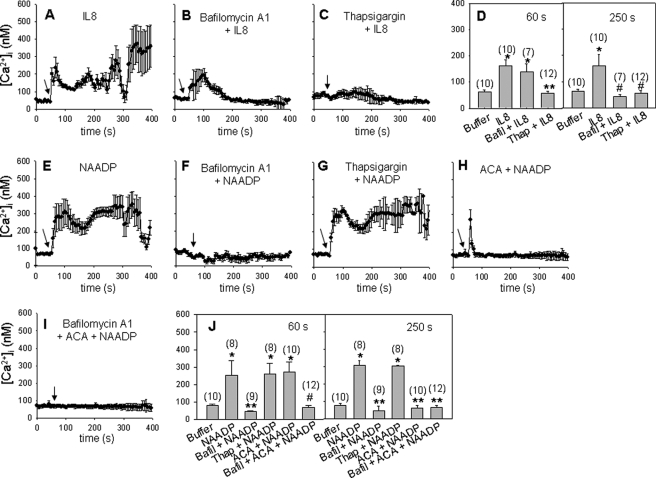
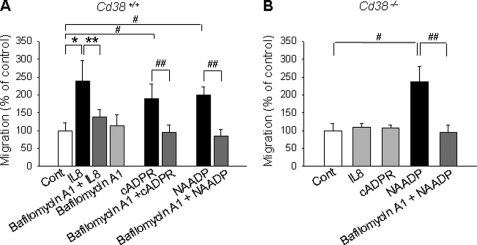
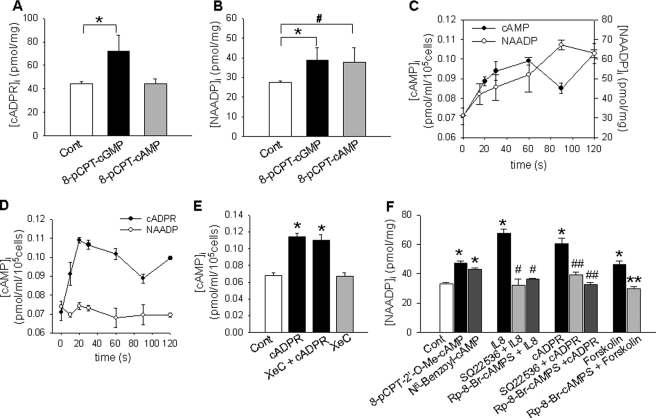
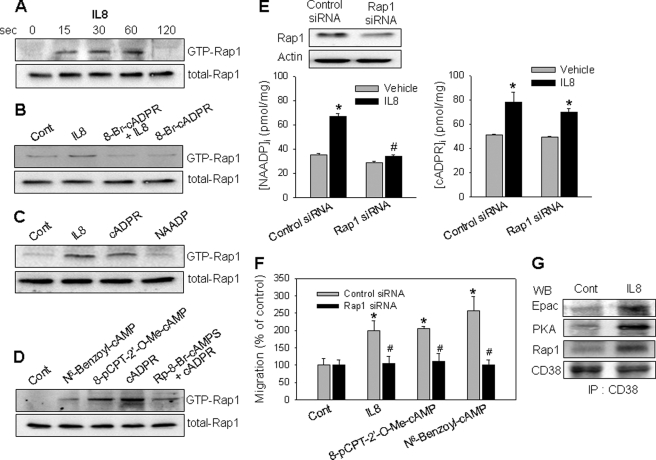
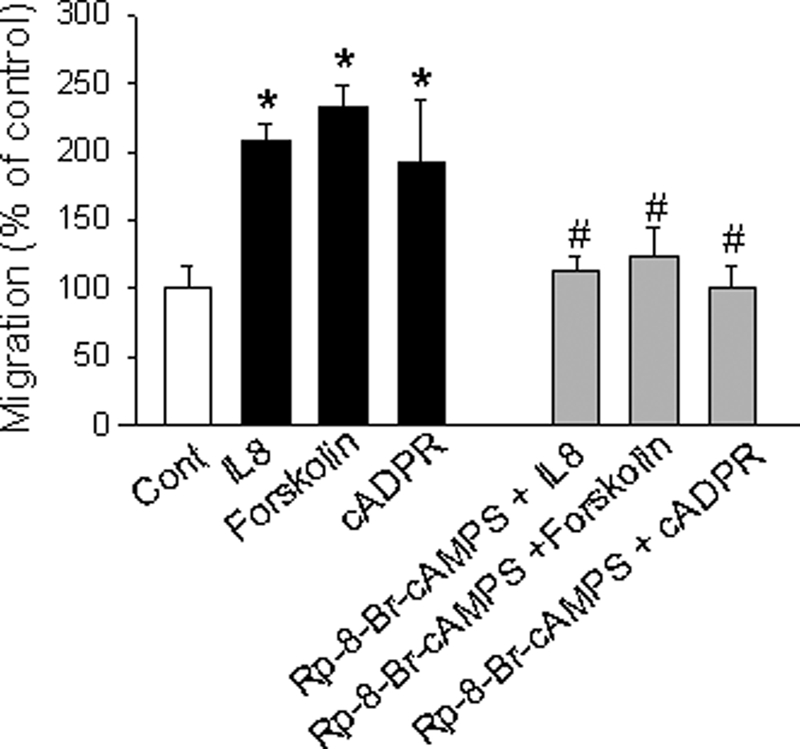
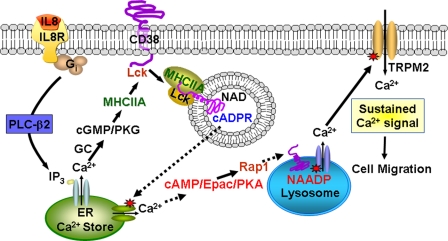
We have previously demonstrated that cyclic ADP-ribose (cADPR) is a calcium signaling messenger in interleukin 8 (IL-8)-induced lymphokine-activated killer (LAK) cells. In this study we examined the possibility that IL-8 activates CD38 to produce another messenger, nicotinic acid adenine dinucleotide phosphate (NAADP), in LAK cells, and we showed that IL-8 induced NAADP formation after cADPR production. These calcium signaling messengers were not produced when LAK cells prepared from CD38 knock-out mice were treated with IL-8, indicating that the synthesis of both NAADP and cADPR is catalyzed by CD38 in LAK cells. Application of cADPR to LAK cells induced NAADP production, whereas NAADP failed to increase intracellular cADPR levels, confirming that the production of cADPR precedes that of NAADP in IL-8-treated LAK cells. Moreover, NAADP increased intracellular Ca(2+) signaling as well as cell migration, which was completely blocked by bafilomycin A1, suggesting that NAADP is generated in lysosome-related organelles after cADPR production. IL-8 or exogenous cADPR, but not NAADP, increased intracellular cAMP levels. cGMP analog, 8-(4-chlorophenylthio)-guanosine 3',5'-cyclic monophosphate, increased both cADPR and NAADP production, whereas the cAMP analog, 8-(4-chlorophenylthio)-cAMP, increased only NAADP production, suggesting that cAMP is essential for IL-8-induced NAADP formation. Furthermore, activation of Rap1, a downstream molecule of Epac, was required for IL-8-induced NAADP formation in LAK cells. Taken together, our data suggest that IL-8-induced NAADP production is mediated by CD38 activation through the actions of cAMP/Epac/protein kinase A/Rap1 in LAK cells and that NAADP plays a key role in Ca(2+) signaling of IL-8-induced LAK cell migration.


Figures

FIGURE 1.
FIGURE 1.
Treatment of LAK cells with IL-8 induces the production of NAADP by CD38. LAK cells prepared from CD38+/+ and Cd38−/− were treated with 10 pm IL-8 for 90 s, and then the concentrations of NAADP formed were measured with the cyclic enzymatic assay. The means ± S.E. of five independent experiments are shown. *, p < 0.05, control (CONT) versus IL-8.
FIGURE 2.
FIGURE 2.
IP3-mediated Ca2+ increase is required for IL-8-mediated cADPR/NAADP production and Ca2+ signaling in LAK cells. A and B, XeC inhibited IL-8-induced increase of [cADPR]i and [NAADP]i. Levels of cADPR and NAADP were determined after treatment of LAK cells with 10 pm IL-8. LAK cells were preincubated with 2 μm XeC for 15 min before incubation with IL-8. The means ± S.E. of three independent experiments are shown. * and #, p < 0.05, control versus IL-8; ** and ##, p < 0.005, IL-8 versus IL-8 plus XeC. C, IL-8-stimulated increase is shown in [Ca2+]i with (open circle) and without (closed circle) XeC. Arrows indicate the time points of the addition of IL-8.
FIGURE 3.
FIGURE 3.
IL-8 induces NAADP production after cADPR formation. A, LAK cells were treated with 10 pm IL-8 for the indicated times, and then cADPR (closed circle) and NAADP (open circle) concentrations were measured. The means ± S.E. of three independent experiments are shown. B, after LAK cells were treated with 200 μm cADPR for the indicated times, the levels of NAADP were measured. The means ± S.E. of three independent experiments are shown. C, cADPR levels were measured in LAK cells treated with 50 nm NAADP for the indicated times. The means ± S.E. of three independent experiments are shown. D, IL-8-induced NAADP formation was blocked by 8-Br-cADPR. LAK cells were preincubated with 100 μm 8-Br-cADPR for 15 min before incubation with 10 pm IL-8 for 90 s. XeC (2 μm) was preincubated for 15 min before the treatment with cADPR (200 μm) for 30 s. The means ± S.E. of three independent experiments are shown. *, p < 0.05, control versus IL-8 or cADPR or cADPR plus XeC; **, p < 0.005, IL-8 versus IL-8 plus 8-Br-cADPR. Cont, control. E, NAADP levels of LAK cells, which were prepared from CD38+/+ and Cd38−/−, were measured after treatment with 200 μm cADPR for 30 s. The means ± S.E. of three independent experiments are shown. *, p < 0.05, control versus cADPR. F, cADPR-stimulated increase in [Ca2+]i was measured in LAK cells prepared from wild type and CD38 knock-out mice. Arrows indicate the time points of the addition of 200 μm cADPR. Before treatment with cADPR, 8-Br-cADPR (200 μm), XeC (2 μm), or dipyridamole (100 μm) was preincubated at 37 °C for 15 min. n indicates the number of cells examined for Ca2+ measurement. G, TRPM2 knockdown using siRNA is shown. A total of 60 pmol of siRNA was transfected into 5 × 10⁵ cells using a transfection reagent. After 48 h of transfection, the cells were subjected to immunoblotting with anti-TRPM2 pAb (upper panel) and the densitometric changes of TRPM2 expression (lower panel) are shown. *, p < 0.05, control siRNA versus TRPM2 siRNA. H, NAADP formation by cADPR was not inhibited in TRPM2 knockdown LAK cells. NAADP formed was measured after the treatment with cADPR (200 μm) for 30 s in LAK cells. The means ± S.E. of three independent experiments are shown. *, p < 0.05, control versus cADPR.
FIGURE 4.
FIGURE 4.
IL-8-inducd NAADP formation is mediated by Ca2+ release from thapsigargin sensitive store by cADPR. A, LAK cells pretreated with bafilomycin A1 (1 μm), thapsigargin (10 μm), or glycylphenylalanine-2-naphthylamide (GPN, 50 μm) for 20 min were incubated with 10 pm IL-8 at 37 °C for 90 s. Then the levels of NAADP were measured as described under “Experimental Procedures.” The means ± S.E. of three independent experiments are shown. *, p < 0.05, control (Cont) versus IL-8; #, p < 0.005, IL-8 versus IL-8 plus thapsigargin or IL-8 versus IL-8 plus bafilomycin A1 or IL-8 versus IL-8 plus glycylphenylalanine-2-naphthylamide. B, LAK cells pretreated with bafilomycin A1(1 μm) or thapsigargin (10 μm) for 20 min were incubated with 200 μm cADPR. After incubation for 30 s, NAADP levels were measured as described under “Experimental Procedures.” The means ± S.E. of three independent experiments are shown. *, p < 0.05, control versus cADPR; #, p < 0.005, cADPR versus cADPR plus thapsigargin or cADPR versus cADPR plus bafilomycin A1.
FIGURE 5.
FIGURE 5.
NAADP releases Ca2+ from lysosome-like acidic organelles in IL-8-induced Ca2+ signaling. A–I, LAK cells were loaded with Fluo-3, and the changes in Ca2+ level were measured. The time points of 10 pm IL-8 or 50 nm NAADP additions are indicated by the arrows. Cells were preincubated with 1 μm bafilomycin A1 (B) or 10 μm thapsigargin (C) for 20 min before IL-8 treatment. D, shown is a direct comparison of mean [Ca2+]i during increases of [Ca2+]i. The data shown are analyzed at 60 s. *, p < 0.05, buffer versus IL-8 or IL-8 plus bafilomycin A1 (Balfil); **, p < 0.001, IL-8 versus IL-8 plus thapsigargin (Thap). The data shown are analyzed at 250 s. *, p < 0.05, buffer versus IL-8; #, p < 0.01, IL-8 versus IL-8 plus bafilomycin A1 or IL-8 plus thapsigargin. Also, NAADP was applied after the cells were preincubated with 1 μm bafilomycin A1 (F) or 10 μm thapsigargin (G) or 20 μm ACA (H) for 20 min. J, shown is a direct comparison of mean [Ca2+]i during increases of [Ca2+]i. The data shown are analyzed at 60 s. *, p < 0.05, buffer versus NAADP or NAADP plus thapsigargin or NAADP plus ACA; **, p < 0.005, NAADP versus NAADP plus bafilomycin A1; #, p < 0.001, ACA plus NAADP versus ACA plus NAADP plus bafilomycin A1. The data shown are analyzed at 250 s. *, p < 0.05, buffer versus NAADP or NAADP plus thapsigargin; **, p < 0.001, NAADP versus NAADP plus bafilomycin A1 or NAADP plus ACA or NAADP plus ACA plus bafilomycin A1. Cell numbers are presented in the parentheses. Data are the mean ± S.E.
FIGURE 6.
FIGURE 6.
NAADP-mediated signal is essential for IL-8-induced migratory activity of LAK cells. LAK cells, prepared from CD38+/+ (A) and Cd38−/− (B), were preincubated with 1 μm bafilomycin A1 for 20 min, and then the cells were incubated with 10 pm IL-8 or 200 μm cADPR or 50 nm NAADP. After incubation for 2 h, cell migration was assayed as described under “Experimental Procedures.” The means ± S.E. of three independent experiments are shown. *, p < 0.05, control (Cont) versus IL-8; **, p < 0.01, IL-8 versus IL-8 plus bafilomycin A1; #, p < 0.005, control versus cADPR or NAADP; ##, p < 0.05, cADPR versus cADPR plus bafilomycin A1 or NAADP versus NAADP plus bafilomycin A1.
FIGURE 7.
FIGURE 7.
NAADP formation is mediated by cAMP/Epac/PKA. A and B, cADPR formation is mediated by cGMP, whereas NAADP formation is regulated by cAMP and cGMP. LAK cells were treated with a cell-permeable cGMP analog, 8-pCPT-cGMP (100 μm), or a cell permeable cAMP analog, 8-pCPT-cAMP (100 μm), for 15 s. Then cADPR production and NAADP production were measured as described under “Experimental Procedures.” The means ± S.E. of three independent experiments are shown. *, p < 0.05, control (Cont) versus 8-pCPT-cGMP; #, p < 0.001, control versus 8-pCPT-cAMP. C, IL-8-induced cAMP increase precedes NAADP formation. Levels of cAMP and NAADP were determined after LAK cells were treated with 10 pm IL-8 for the indicated times. The means ± S.E. of three independent experiments are shown. D, cADPR but not NAADP induces cAMP increase. Levels of cAMP were determined after LAK cells were treated with 200 μm cADPR or 50 nm NAADP for the indicated times. The means ± S.E. of three independent experiments are shown. E, shown is the effect of XeC on cADPR-induced cAMP increase. Levels of cAMP were determined after the LAK cells were treated with 200 μm cADPR for 30 s. XeC (2 μm) was preincubated for 15 min. The means ± S.E. of three independent experiments are shown. *, p < 0.05, control versus cADPR or cADPR plus XeC. F, levels of NAADP were determined after the treatment of LAK cells with 100 μm 8-pCPT-2′-O-Me-cAMP (Epac activator), 100 μm N6-benzoyl-cAMP (PKA activator), 10 pm IL-8, 200 μm cADPR, or 1 μm forskolin. 8-pCPT-2′-O-Me-cAMP, N6-benzoyl-cAMP, cADPR, and forskolin were treated for 30 s, and IL-8 was treated for 90 s. Rp-8-Br-cAMPS (100 μm) and SQ22,536 (250 μm) were preincubated for 30 min. The levels of NAADP were measured as described under “Experimental Procedures.” The means ± S.E. of three independent experiments are shown. *, p < 0.05, control versus 8-pCPT-2′-O-Me-cAMP or N6-benzoyl-cAMP or IL-8 or cADPR or forskolin; #, p < 0.005, IL-8 versus IL-8 plus SQ22,536 or IL-8 plus Rp-8-Br-cAMPS; ##, p < 0.01, cADPR versus cADPR plus SQ22,536 or cADPR plus Rp-8-Br-cAMPS; **, p < 0.05, forskolin versus forskolin plus Rp-8-Br-cAMPS.
FIGURE 8.
FIGURE 8.
IL-8 induces Rap1 activation through association of CD38 with Epac, PKA, and Rap1. A, IL-8 activates Rap1. LAK cells were treated with 10 pm IL-8 for a specified time, after which a pulldown assay was used to detect the active form of Rap1. B, 8-Br-cADPR blocks IL-8-induced Rap1 activation. The cells were preincubated with 8-Br-cADPR (100 μm) for 20 min before treatment with 10 pm IL-8 for 60 s. C, cADPR but not NAADP activates Rap1. LAK cells were treated with 200 μm cADPR or 50 nm NAADP for 30 s. D, cADPR-induced Rap1 activation was inhibited by a PKA inhibitor. Rap1 activation was determined after the treatment of LAK cells with 100 μm N6-benzoyl-cAMP, 100 μm 8-pCPT-2′-O-Me-cAMP, or 200 μm cADPR for 30 s. The cells were preincubated with Rp-8-Br-cAMPS (100 μm) for 30 min before treatment with 200 μm cADPR. E, Rap1 knockdown in LAK cells exhibits a reduced NAADP formation by IL-8 but not cADPR formation. A total of 60 pmol of siRNA was transfected into 5 × 10⁵ cells using a transfection reagent. After 48 h of transfection, the cells were subjected to immunoblotting with anti-Rap1 pAb (upper panel) and measurement of NAADP/cADPR formation (lower panel) as described under “Experimental Procedures.” The means ± S.E. of three independent experiments are shown. *, p < 0.05, control (Cont) versus IL-8; #, p < 0.01, IL-8 in control siRNA versus IL-8 in Rap1 siRNA. F, IL-8/Epac/PKA-mediated cell migration is blocked in Rap1 knockdown LAK cells. Cells were treated with 10 pm IL-8, 100 μm 8-pCPT-2′-O-Me-cAMP, or 100 μm N6-benzoyl-cAMP. After incubation for 2 h, cell migration was assayed as described under “Experimental Procedures.” The means ± S.E. of three independent experiments are shown. *, p < 0.05, control versus IL-8 or 8-pCPT-2′-O-Me-cAMP or N6-benzoyl-cAMP; **, p < 0.01, IL-8 in control siRNA versus IL-8 in Rap1 siRNA or 8-pCPT-2′-O-Me-cAMP in control siRNA versus 8-pCPT-2′-O-Me-cAMP in Rap1 siRNA or N6-benzoyl-cAMP in control siRNA versus N6-benzoyl-cAMP in Rap1 siRNA. G, IL-8 induces the association of CD38 with Epac, PKA, and Rap1. LAK cells were treated with IL-8 for 30 s. The cells were extracted with a lysis buffer and then subjected to immunoprecipitation (IP) using anti-CD38 mAb. The immunoprecipitated proteins were analyzed by immunoblotting (WB) with anti-CD38 pAb, anti-Epac pAb, anti-PKA pAb, or anti-Rap1 pAb.
FIGURE 9.
FIGURE 9.
Epac and PKA mediate IL-8-induced migratory activity of LAK cells. LAK cells were treated with 10 pm IL-8, 1 μm forskolin, or 200 μm cADPR. Cells were preincubated with 100 μm Rp-8-Br-cAMPS, a PKA inhibitor, for 20 min. After incubation of cells with various reagents at 37 °C for 2 h, the cells in the top chamber were removed, and the cells adhered to the bottom of the filters were stained with Wright-Giemsa. Cells were counted under a phase-contrast microscope. The means ± S.E. of three independent experiments are shown. *, p < 0.05, control versus IL-8 or forskolin or cADPR; #, p < 0.005, IL-8 versus IL-8 plus Rp-8-Br-cAMPS or forskolin versus forskolin plus Rp-8-Br-cAMPS or cADPR versus cADPR plus Rp-8-Br-cAMPS.
FIGURE 10.
FIGURE 10.
Schematic pathway of IL-8-mediated NAADP formation by CD38 in LAK cells. Ligation of IL-8 receptor (IL8R) stimulates phospholipase Cβ2 (PLC2) via Gi, resulting in production of IP3 and diacylglycerol. IP3 binds to the receptor releasing Ca2+ from endoplasmic reticulum (ER) Ca2+ stores. IP3-mediated increase of intracellular Ca2+ levels results in elevation of cGMP levels via guanylyl cyclase (GC), thus activating protein kinase G (PKG) (24). Phosphorylated nonmuscle myosin IIA (MHCIIA) by protein kinase G is recruited in the CD38-Lck complex, inducing the internalization of CD38 and cADPR production (40). The cADPR produced by CD38 in the endocytic vesicles is transported via the promiscuous nucleoside/cADPR transporters, as previously described (35), or by the internalized CD38 itself, as previously proposed (61). cADPR-mediated Ca2+ release induces NAADP production by Rap1 activation via cAMP/Epac/PKA, resulting in release of Ca2+ from lysosome-related acidic organelles. NAADP-mediated Ca2+ release regulates the Ca2+ influx through TRPM2 channel in LAK cells, resulting in cell migration of LAK cells.

Similar articles

Cited by

References

    1. Lund F., Solvason N., Grimaldi J. C., Parkhouse R. M., Howard M. (1995) Immunol. Today 16, 469–473 - PubMed
    1. Mehta K., Shahid U., Malavasi F. (1996) FASEB J. 10, 1408–1417 - PubMed
    1. Kim H., Jacobson E. L., Jacobson M. K. (1993) Science 261, 1330–1333 - PubMed
    1. Howard M., Grimaldi J. C., Bazan J. F., Lund F. E., Santos-Argumedo L., Parkhouse R. M., Walseth T. F., Lee H. C. (1993) Science 262, 1056–1059 - PubMed
    1. Zocchi E., Franco L., Guida L., Benatti U., Bargellesi A., Malavasi F., Lee H. C., De Flora A. (1993) Biochem. Biophys. Res. Commun. 196, 1459–1465 - PubMed

Publication types