. 2010 Jul 2;285(27):20993-1003.
doi: 10.1074/jbc.M110.126599. Epub 2010 May 4.

A small molecule inhibitor of endoplasmic reticulum oxidation 1 (ERO1) with selectively reversible thiol reactivity

Affiliations

A small molecule inhibitor of endoplasmic reticulum oxidation 1 (ERO1) with selectively reversible thiol reactivity

Jaime D Blais et al. J Biol Chem. .

Abstract

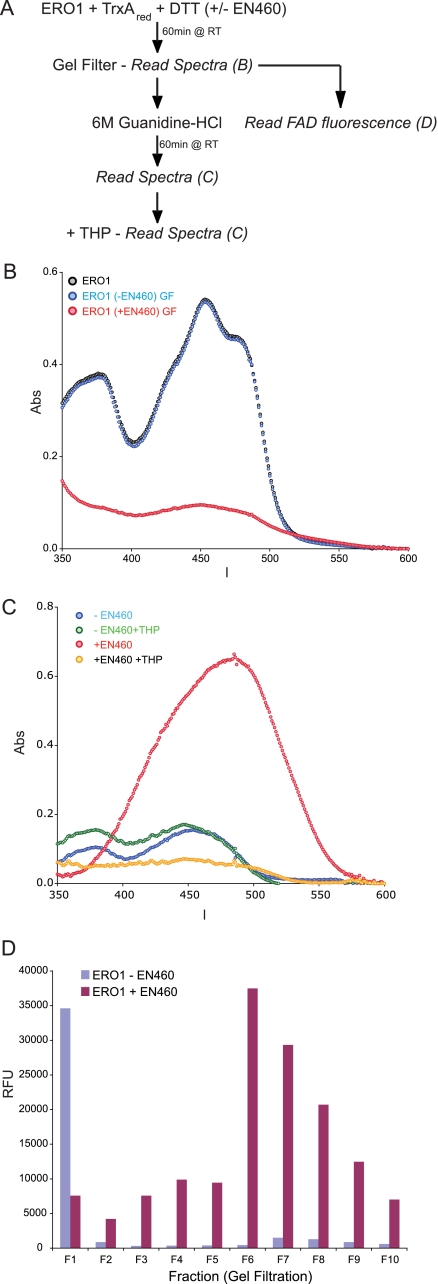
Endoplasmic reticulum oxidation 1 (ERO1) is a conserved eukaryotic flavin adenine nucleotide-containing enzyme that promotes disulfide bond formation by accepting electrons from reduced protein disulfide isomerase (PDI) and passing them on to molecular oxygen. Although disulfide bond formation is an essential process, recent experiments suggest a surprisingly broad tolerance to genetic manipulations that attenuate the rate of disulfide bond formation and that a hyperoxidizing ER may place stressed cells at a disadvantage. In this study, we report on the development of a high throughput in vitro assay for mammalian ERO1alpha activity and its application to identify small molecule inhibitors. The inhibitor EN460 (IC(50), 1.9 mum) interacts selectively with the reduced, active form of ERO1alpha and prevents its reoxidation. Despite rapid and promiscuous reactivity with thiolates, EN460 exhibits selectivity for ERO1. This selectivity is explained by the rapid reversibility of the reaction of EN460 with unstructured thiols, in contrast to the formation of a stable bond with ERO1alpha followed by displacement of bound flavin adenine dinucleotide from the active site of the enzyme. Modest concentrations of EN460 and a functionally related inhibitor, QM295, promote signaling in the unfolded protein response and precondition cells against severe ER stress. Together, these observations point to the feasibility of targeting the enzymatic activity of ERO1alpha with small molecule inhibitors.


Figures

FIGURE 1.
FIGURE 1.
A kinetic in vitro assay for mammalian ERO1α activity. A, scheme of assay: ERO1α activity is measured by a coupled fluorescence assay that detects the production of H2O2 upon oxidation of reduced substrate (thioredoxin A, TrxA; a surrogate for PDI), by recombinant mouse ERO1α (purified from Escherichia coli). HRP uses the H2O2 produced to oxidize the nonfluorescent AUR to a fluorescent molecule. B, shown is a time course of AUR fluorescence in reactions containing the indicated concentration of TrxAred and ERO1α (200 nm). RFU, relative fluorescence unit. THP (20 μm) was included as an electron donor. Inset, a plot of the initial rate of AUR fluorescence as a function of TrxAred concentration is shown. Shown are representative experiments reproduced more than three times. C, time course of AUR fluorescence in reactions containing the indicated concentration of ERO1α and TrxAred (20 μm). D, ERO1α turnover number as calculated by plotting the rate of H2O2 production (extracted from the initial rate of the change in AUR fluorescence in C) against the concentration of ERO1α in the reaction shown in C. Shown are representative experiments reproduced more than three times.
FIGURE 2.
FIGURE 2.
ERO1α inhibitors identified. A, structure of the inhibitors EN460 and QM295. B, a time course of AUR fluorescence in reactions containing the indicated concentration of each inhibitor. Shown are representative experiments reproduced more than three times. C, plot of percent inhibition as a function of compound concentration extracted from the initial velocity of the change in AUR fluorescence in the reactions shown in B. Data fitting with Sigma plot (n = 4). D, time-dependent changes in oxygen concentration in reactions containing ERO1α (1 μm) and TrxAred (50 μm) with or without EN460 or QM295 (50 μm). Shown is an experiment reproduced twice. E, immunoblot of ERO1α (1 μm) reacted for the indicated time with TrxAred (10 μm) in the absence or presence of EN460 or QM295 (25 μm) followed by quenching with AMS and separating each time point on a nonreducing SDS-PAGE. F, Coomassie-stained Tris-Tricine gel of TrxAred (10 μm) reacted for the indicated time with ERO1α (1 μm) in the absence or presence of EN460 (25 μm). Shown is an experiment reproduced twice. std error, S.E.
FIGURE 3.
FIGURE 3.
Inhibition of endogenous ERO1α in vivo. A, immunoblot of endogenous ERO1α in lysates of untreated MEFs or MEFs exposed to DTT (10 mm, 30 min), EN460 or QM295 (50 μm, 30 min). MEFs were washed and lysed in the presence of NEM, and SDS-solubilized proteins were resolved on a nonreducing SDS-PAGE. ERO1ox, oxidized ERO1. B, immunoblot of endogenous ERO1α in lysates prepared as in A. The MEFs were exposed to a 30-min “pulse” of DTT (10 mm) followed by DTT-free “chase” for the indicated time in the absence or presence of QM295 (50 μm). ERO1ox, oxidized ERO1. Shown is an experiment reproduced twice. C, relative luciferase activity from an unfolded protein response reporter (ATF6::luciferase) in the 293T cell line after 16 h of exposure to the indicated concentrations of EN460 or QM295 or tunicamycin as a positive control. RFU, relative fluorescence unit. Values shown are the mean ± S.D. (n = 3) (*, p < 0.05, **, p < 0.01, two-tailed unpaired Student's t test compared with the untreated sample). D, survival of ER stress-hypersensitive Perk−/− MEFs that received no treatment (no tmt) or were treated with the indicated concentrations of EN460 or QM295 or TGD37BZ (TGD, a known protective compound, 20), followed by subsequent challenge with the indicated concentration of tunicamycin (Tm) for 24 h. Survival is expressed as relative amount of WST-1 reduced by tunicamycin-exposed cells compared with unexposed cells (arbitrarily set to 100%). Values shown are the mean ± S.D. (n = 3) (*, p < 0.05, **, p < 0.01, two-tailed unpaired Student's t test, relative to no treatment cells at each concentration of tunicamycin).
FIGURE 4.
FIGURE 4.
Sustained inhibition of ERO1α by EN460. A, schema of the experimental design to test the reversibility of ERO1α inhibition by EN460, using a colorimetric end point Ellman assay. The color-coding of the experimental arms is maintained in B, below. RT, room temperature. B, absorbance (Abs) of the Ellman reagent (DTNB) added 60 min after ERO1α, TrxA, and DTT were combined to allow ERO1α-mediated oxidation of free thiols. Retention of full ERO1α activity is signaled by the depletion of substrate thiols (as in B, lane 9). The indicated concentration of EN460 was included during the 60-min incubation in samples 5–8, whereas in samples 10 and 12, the same final concentration of EN460 and ERO1α as in lane 8 were attained by diluting a 100-fold concentrated solution of enzyme and inhibitor that were previously allowed to react for 60 min in a preincubation step (PI) in the absence of DTT (nonreducing conditions, NR; samples 10 and 11) or in its presence (reducing conditions, R; samples 12 and 13, **, p < 0.01, two tailed unpaired Student's t test). C, schema of the experimental design to test the reversibility of ERO1α inhibition by EN460, using the AUR fluorescence assay. The color-coding of the experimental arms in the cartoon corresponds to those in D. RT, room temperature. D, ERO1α activity measured by time-dependent AUR florescence. RFU, relative fluorescence unit. Where indicated ERO1α had previously been exposed to EN460 under reducing (+DTT) or non-reducing (−DTT) conditions for 60 min before gel filtration to separate the enzyme from free EN460. Shown is a representative experiment reproduced three times.
FIGURE 5.
FIGURE 5.
Spectroscopic evidence that EN460 reacts reversibly with free thiols. A, absorbance (Abs) spectra of EN460 (200 μm) before and after the addition of 200 μm DTT (black and red lines, respectively). B, time dependence of change in absorbance at 470 nm (upper panel) and 290 nm (lower panel) during the reaction of EN460 (100 μm) with DTT, reduced GSH, THP, and TCEP (all at 500 μm). C, time dependence of change in absorbance at 470 nm (upper panel) and 290 nm (lower panel) of EN460 that had been reacted with DTT, THP, or TCEP (as above) and subsequently exposed to NEM (10 mm) at t = 0. Shown is a representative experiment reproduced three times.
FIGURE 6.
FIGURE 6.
Spectroscopic evidence that the EN460 interaction with ERO1α thiols is stabilized by the protein structure. A, comparison of the spectrum of protein samples after gel filtration: ERO1α alone, with TrxA and DTT, and after including EN460 in the reductive incubation. A further control sample contained TrxA, DTT, and EN460 but not ERO1α. B, schema of the experimental design to test the reversibility of the EN460 interaction with ERO1α thiols by absorbance spectra. The color-coding of the experimental arms is maintained in C. RT, room temperature. C, time-dependent change in absorbance (Abs) of ERO1α that had been reacted with EN460 under reducing conditions and then gel-filtered to remove unbound small molecules, followed by denaturation in guanidine HCl (GDN), alkylation with NEM or a combination of both (all at t = 0). Shown is a representative experiment reproduced three times.
FIGURE 7.
FIGURE 7.
Reaction of ERO1α with EN460 displaces the bound FAD. A, schema of the experimental design to measure the FAD absorbance (Abs) and fluorescence after exposure of ERO1α to EN460. RT, room temperature. B, absorbance (in the visible region of the spectra) of ERO1α, first reacted with EN460 (in the presence of TrxA and DTT) and then gel-filtered (GF; to remove unbound small molecules). Note the substantial disappearance of the FAD absorption spectrum in the sample that had been exposed to EN460. C, visible absorbance of denatured and alkylated ERO1α that had or had not been previously reacted with EN460. Where indicated, THP was added to reduce the released EN460 and reveal any underlying FAD absorbance. D, FAD fluorescence of fractions from the gel filtration of ERO1α that had or had not been reacted with EN460 under reducing conditions. The fractions were denatured and adjusted to pH 2, before measuring FAD fluorescence. Shown is a representative experiment that was reproduced three times.
FIGURE 8.
FIGURE 8.
Reconstitution of EN460-inhibited ERO1α activity with exogenous FAD. A, schema of the experimental design to test the role of FAD in reconstitution of inhibited ERO1α. RT, room temperature. B, time-dependent change of AUR fluorescence in an assay performed in the presence of uninhibited ERO1α and EN460-inhibited ERO1α that had been subsequently incubated with THP, FAD, or both, followed by gel filtration to remove unbound small molecules. C, FAD fluorescence of the protein peak (fraction 1) of gel-filtered ERO1α from the three experimental arms (as in Fig. 7D). GDN, guanidine HCl. RFU, relative fluorescence unit.

References

    1. Anfinsen C. B., Redfield R. R. (1956) Adv. Protein Chem. 11, 1–100 - PubMed
    1. Appenzeller-Herzog C., Ellgaard L. (2008) Biochim. Biophys. Acta. 1783, 535–548 - PubMed
    1. Tu B. P., Weissman J. S. (2004) J. Cell Biol. 164, 341–346 - PMC - PubMed
    1. Sevier C. S., Kaiser C. A. (2008) Biochim. Biophys. Acta. 1783, 549–556 - PubMed
    1. Gross E., Kastner D. B., Kaiser C. A., Fass D. (2004) Cell 117, 601–610 - PubMed

Publication types

MeSH terms

LinkOut - more resources