

Extracorporeal membrane oxygenation causes loss of intestinal epithelial barrier in the newborn piglet
- PMID: 20442689
- PMCID: PMC2914515
- DOI: 10.1203/PDR.0b013e3181e4c9f8
Extracorporeal membrane oxygenation causes loss of intestinal epithelial barrier in the newborn piglet
Abstract
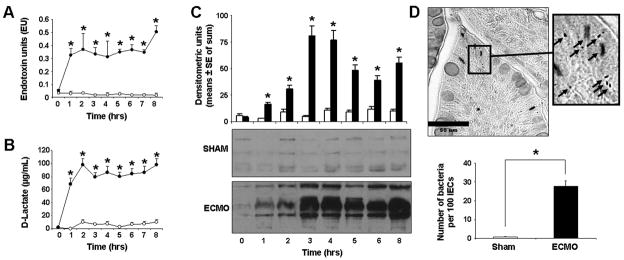
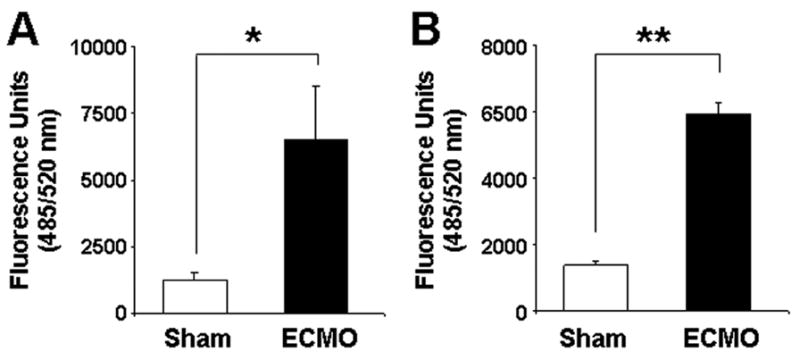
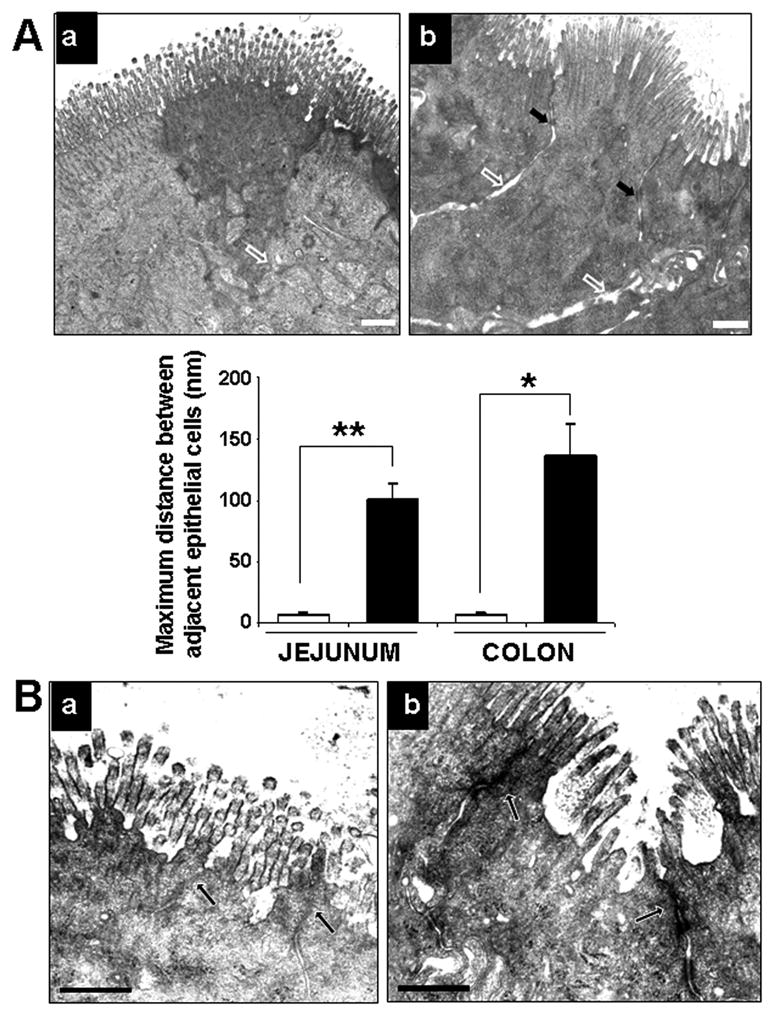
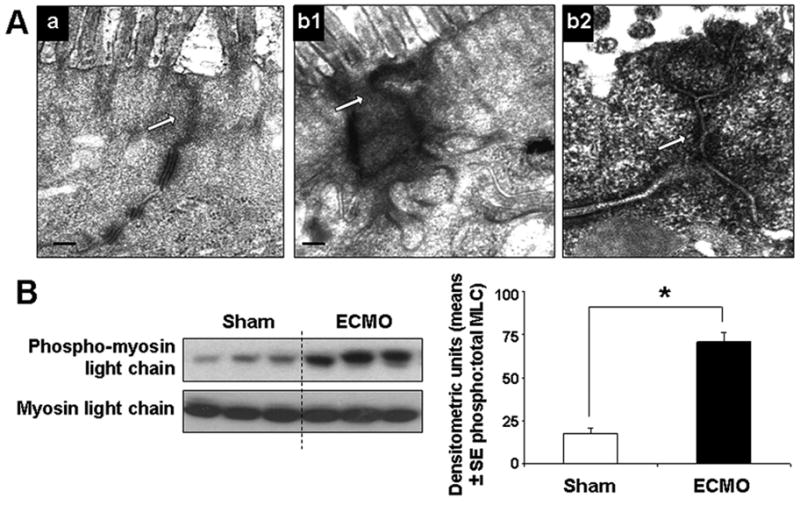
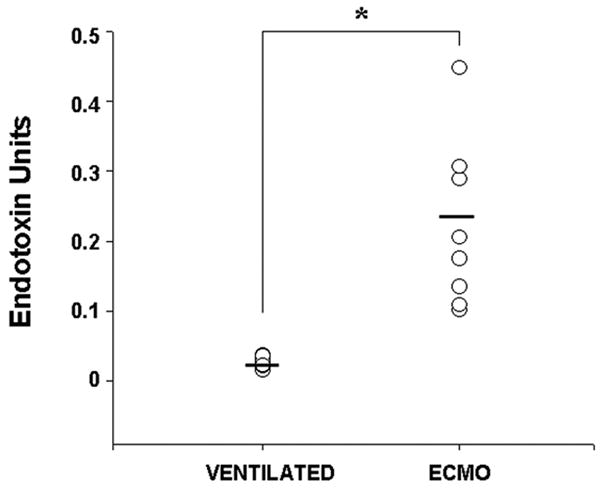
Extracorporeal membrane oxygenation (ECMO) is an important life-support system used in neonates and young children with intractable cardiorespiratory failure. In this study, we used our porcine neonatal model of venoarterial ECMO to investigate whether ECMO causes gut barrier dysfunction. We subjected 3-wk-old previously healthy piglets to venoarterial ECMO for up to 8 h and evaluated gut mucosal permeability, bacterial translocation, plasma levels of bacterial products, and ultrastructural changes in gut epithelium. We also measured plasma lipopolysaccharide (LPS) levels in a small cohort of human neonates receiving ECMO. In our porcine model, ECMO caused a rapid increase in gut mucosal permeability within the first 2 h of treatment, leading to a 6- to 10-fold rise in circulating bacterial products. These changes in barrier function were associated with cytoskeletal condensation in epithelial cells, which was explained by phosphorylation of a myosin II regulatory light chain. In support of these findings, we also detected elevated plasma LPS levels in human neonates receiving ECMO, indicating a similar loss of gut barrier function in these infants. On the basis of these data, we conclude that ECMO is an independent cause of gut barrier dysfunction and bacterial translocation may be an important contributor to ECMO-related inflammation.
Figures
Similar articles
-
Effects of continuous renal replacement therapy on intestinal mucosal barrier function during extracorporeal membrane oxygenation in a porcine model.J Cardiothorac Surg. 2014 Apr 23;9:72. doi: 10.1186/1749-8090-9-72. J Cardiothorac Surg. 2014. PMID: 24758270 Free PMC article.
-
Intestinal epithelial apoptosis initiates gut mucosal injury during extracorporeal membrane oxygenation in the newborn piglet.Lab Invest. 2014 Feb;94(2):150-60. doi: 10.1038/labinvest.2013.149. Epub 2013 Dec 23. Lab Invest. 2014. PMID: 24365747 Free PMC article.
-
Plasma concentrations of inflammatory cytokines rise rapidly during ECMO-related SIRS due to the release of preformed stores in the intestine.Lab Invest. 2010 Jan;90(1):128-39. doi: 10.1038/labinvest.2009.119. Epub 2009 Nov 9. Lab Invest. 2010. PMID: 19901912 Free PMC article.
-
Cerebrovascular complications and neurodevelopmental sequelae of neonatal ECMO.Clin Perinatol. 1997 Sep;24(3):655-75. Clin Perinatol. 1997. PMID: 9394865 Review.
-
Disruption of the epithelial barrier during intestinal inflammation: Quest for new molecules and mechanisms.Biochim Biophys Acta Mol Cell Res. 2017 Jul;1864(7):1183-1194. doi: 10.1016/j.bbamcr.2017.03.007. Epub 2017 Mar 18. Biochim Biophys Acta Mol Cell Res. 2017. PMID: 28322932 Free PMC article. Review.
Cited by
-
Evaluation of the Oxiris Membrane in Cardiogenic Shock Requiring Extracorporeal Membrane Oxygenation Support: Study Protocol for a Single Center, Single-Blind, Randomized Controlled Trial.Front Cardiovasc Med. 2021 Oct 11;8:738496. doi: 10.3389/fcvm.2021.738496. eCollection 2021. Front Cardiovasc Med. 2021. PMID: 34708091 Free PMC article.
-
Nutrition in Pediatric Extracorporeal Membrane Oxygenation: A Narrative Review.Front Nutr. 2021 Aug 2;8:666464. doi: 10.3389/fnut.2021.666464. eCollection 2021. Front Nutr. 2021. PMID: 34409059 Free PMC article. Review.
-
Fluid Management in Veno-Arterial Extracorporeal Membrane Oxygenation Therapy-Analysis of an Experimental Pig Model.J Clin Med. 2023 Aug 16;12(16):5330. doi: 10.3390/jcm12165330. J Clin Med. 2023. PMID: 37629372 Free PMC article.
-
Effects of continuous renal replacement therapy on intestinal mucosal barrier function during extracorporeal membrane oxygenation in a porcine model.J Cardiothorac Surg. 2014 Apr 23;9:72. doi: 10.1186/1749-8090-9-72. J Cardiothorac Surg. 2014. PMID: 24758270 Free PMC article.
-
The influence of extracorporeal membrane oxygenation therapy on intestinal mucosal barrier in a porcine model for post-traumatic acute respiratory distress syndrome.J Cardiothorac Surg. 2015 Feb 15;10:20. doi: 10.1186/s13019-015-0211-3. J Cardiothorac Surg. 2015. PMID: 25884385 Free PMC article.
References
-
- Hansell DR. Extracorporeal membrane oxygenation for perinatal and pediatric patients. Respir Care. 2003;48:352–362. discussion 363–356. - PubMed
-
- Coppola CP, Tyree M, Larry K, DiGeronimo R. A 22-year experience in global transport extracorporeal membrane oxygenation. J Pediatr Surg. 2008;43:46–52. - PubMed
-
- Butler J, Pathi VL, Paton RD, Logan RW, MacArthur KJ, Jamieson MP, Pollock JC. Acute-phase responses to cardiopulmonary bypass in children weighing less than 10 kilograms. Ann Thorac Surg. 1996;62:538–542. - PubMed
-
- Kozik DJ, Tweddell JS. Characterizing the inflammatory response to cardiopulmonary bypass in children. Ann Thorac Surg. 2006;81:S2347–S2354. - PubMed
-
- Brix-Christensen V. The systemic inflammatory response after cardiac surgery with cardiopulmonary bypass in children. Acta Anaesthesiol Scand. 2001;45:671–679. - PubMed
Publication types
MeSH terms
Substances
Grants and funding
LinkOut - more resources
Full Text Sources
