Electron tomography reveals the steps in filovirus budding
- PMID: 20442788
- PMCID: PMC2861712
- DOI: 10.1371/journal.ppat.1000875
Electron tomography reveals the steps in filovirus budding
Abstract
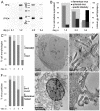
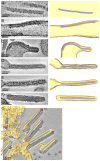
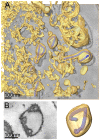
The filoviruses, Marburg and Ebola, are non-segmented negative-strand RNA viruses causing severe hemorrhagic fever with high mortality rates in humans and nonhuman primates. The sequence of events that leads to release of filovirus particles from cells is poorly understood. Two contrasting mechanisms have been proposed, one proceeding via a "submarine-like" budding with the helical nucleocapsid emerging parallel to the plasma membrane, and the other via perpendicular "rocket-like" protrusion. Here we have infected cells with Marburg virus under BSL-4 containment conditions, and reconstructed the sequence of steps in the budding process in three dimensions using electron tomography of plastic-embedded cells. We find that highly infectious filamentous particles are released at early stages in infection. Budding proceeds via lateral association of intracellular nucleocapsid along its whole length with the plasma membrane, followed by rapid envelopment initiated at one end of the nucleocapsid, leading to a protruding intermediate. Scission results in local membrane instability at the rear of the virus. After prolonged infection, increased vesiculation of the plasma membrane correlates with changes in shape and infectivity of released viruses. Our observations demonstrate a cellular determinant of virus shape. They reconcile the contrasting models of filovirus budding and allow us to describe the sequence of events taking place during budding and release of Marburg virus. We propose that this represents a general sequence of events also followed by other filamentous and rod-shaped viruses.
Conflict of interest statement
The authors have declared that no competing interests exist.
Figures


Similar articles
-
Cryo-electron tomography of Marburg virus particles and their morphogenesis within infected cells.PLoS Biol. 2011 Nov;9(11):e1001196. doi: 10.1371/journal.pbio.1001196. Epub 2011 Nov 15. PLoS Biol. 2011. PMID: 22110401 Free PMC article.
-
Filovirus-like particles as vaccines and discovery tools.Expert Rev Vaccines. 2005 Jun;4(3):429-40. doi: 10.1586/14760584.4.3.429. Expert Rev Vaccines. 2005. PMID: 16026254 Review.
-
Intracellular events and cell fate in filovirus infection.Viruses. 2011 Aug;3(8):1501-31. doi: 10.3390/v3081501. Viruses. 2011. PMID: 21927676 Free PMC article. Review.
-
A polymorphism of the TIM-1 IgV domain: implications for the susceptibility to filovirus infection.Biochem Biophys Res Commun. 2014 Dec 12;455(3-4):223-8. doi: 10.1016/j.bbrc.2014.10.144. Epub 2014 Nov 4. Biochem Biophys Res Commun. 2014. PMID: 25449273 Free PMC article.
-
Filovirus assembly and budding.Virology. 2006 Jan 5;344(1):64-70. doi: 10.1016/j.virol.2005.09.018. Virology. 2006. PMID: 16364737 Review.
Cited by
-
Novel antiviral approaches for Marburg: a promising therapeutics in the pipeline.Front Microbiol. 2024 Apr 25;15:1387628. doi: 10.3389/fmicb.2024.1387628. eCollection 2024. Front Microbiol. 2024. PMID: 38725678 Free PMC article. Review.
-
Viral Infection at High Magnification: 3D Electron Microscopy Methods to Analyze the Architecture of Infected Cells.Viruses. 2015 Dec 3;7(12):6316-45. doi: 10.3390/v7122940. Viruses. 2015. PMID: 26633469 Free PMC article. Review.
-
Unveiling a Drift Resistant Cryptotope within Marburgvirus Nucleoprotein Recognized by Llama Single-Domain Antibodies.Front Immunol. 2017 Oct 2;8:1234. doi: 10.3389/fimmu.2017.01234. eCollection 2017. Front Immunol. 2017. PMID: 29038656 Free PMC article.
-
Cryo-electron tomography of Marburg virus particles and their morphogenesis within infected cells.PLoS Biol. 2011 Nov;9(11):e1001196. doi: 10.1371/journal.pbio.1001196. Epub 2011 Nov 15. PLoS Biol. 2011. PMID: 22110401 Free PMC article.
-
Nano- and microparticles at fluid and biological interfaces.J Phys Condens Matter. 2017 Sep 20;29(37):373003. doi: 10.1088/1361-648X/aa7933. Epub 2017 Jun 13. J Phys Condens Matter. 2017. PMID: 28608781 Free PMC article.
References
-
- Peters CJ. Marburg and Ebola–arming ourselves against the deadly filoviruses. N Engl J Med. 2005;352:2571–2573. - PubMed
-
- Feldmann H, Jones S, Klenk HD, Schnittler HJ. Ebola virus: from discovery to vaccine. Nat Rev Immunol. 2003;3:677–685. - PubMed
-
- Hoenen T, Groseth A, Falzarano D, Feldmann H. Ebola virus: unravelling pathogenesis to combat a deadly disease. Trends Mol Med. 2006;12:206–215. - PubMed
-
- Borchert M, Muyembe-Tamfum JJ, Colebunders R, Libande M, Sabue M, et al. Short communication: a cluster of Marburg virus disease involving an infant. Trop Med Int Health. 2002;7:902–906. - PubMed
Publication types
MeSH terms
LinkOut - more resources
Full Text Sources
Other Literature Sources

