

Assessing individual metabolic responsiveness to a lipid challenge using a targeted metabolomic approach
- PMID: 20442800
- PMCID: PMC2862503
- DOI: 10.1007/s11306-008-0136-0
Assessing individual metabolic responsiveness to a lipid challenge using a targeted metabolomic approach
Abstract
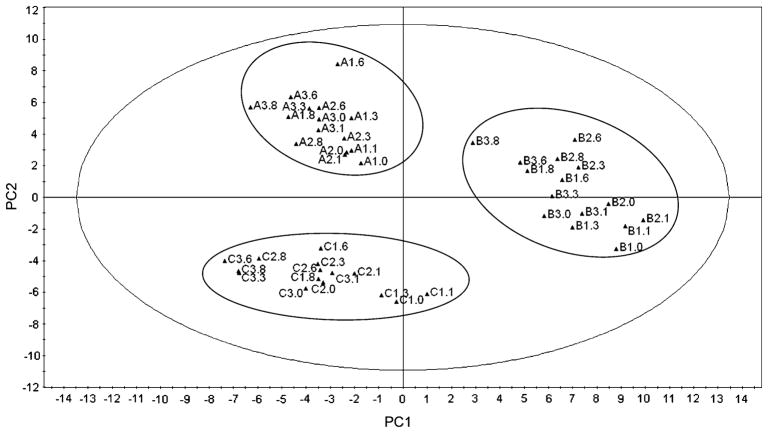
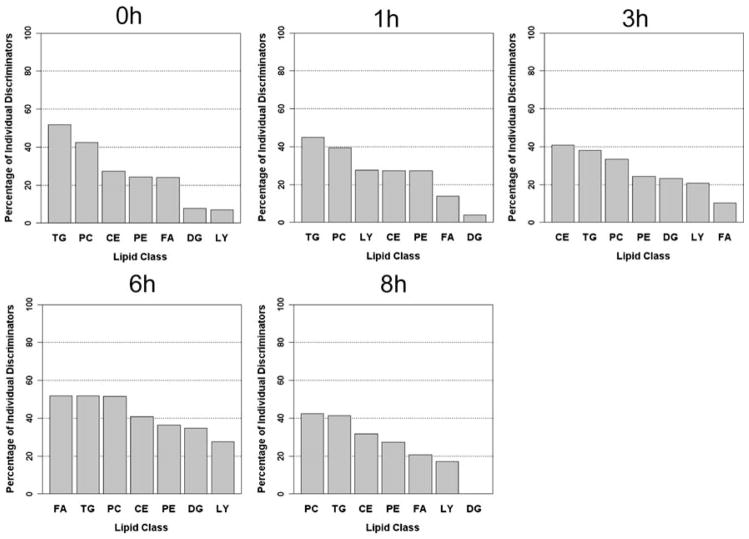
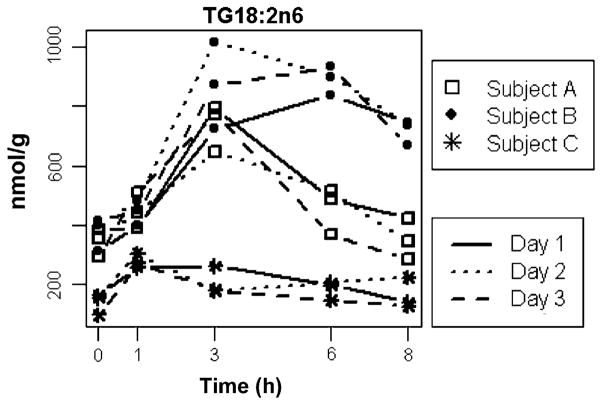
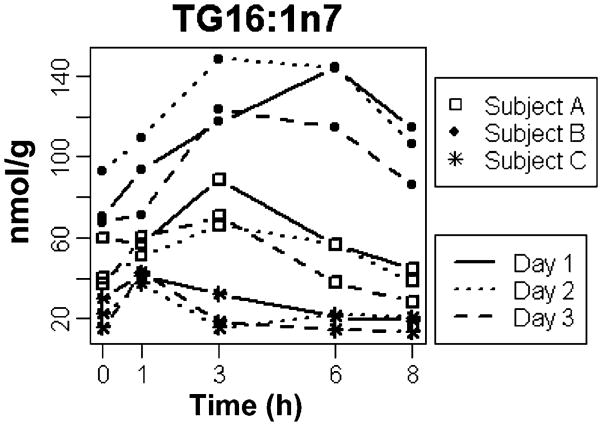
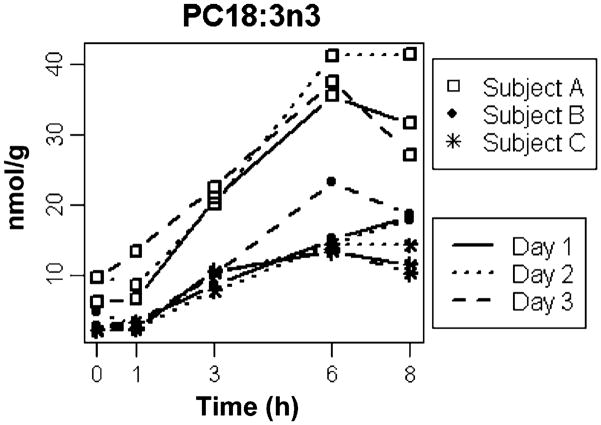
The development of assessment techniques with immediate clinical applicability is a priority for resolving the growing epidemic in metabolic disease. Many imbalances in diet-dependent metabolism are not detectable in the fasted state. Resolving the high inter-individual variability in response to diet requires the development of techniques that can detect metabolic dysfunction at the level of the individual. The intra- and inter-individual variation in lipid metabolism in response to a standardized test meal was determined. Following an overnight fast on three different days, three healthy subjects consumed a test meal containing 40% of their daily calories. Plasma samples were collected at fasting, and 1, 3, 6, and 8 h after the test meal. Plasma fatty acid (FA) concentrations within separated lipid classes and lipoprotein fractions were measured at each time point. The intra-individual variation within each subject across three days was lower than the inter-individual differences among the three subjects for over 50% of metabolites in the triacylglycerol (TG), FA, and phosphatidylcholine (PC) lipid classes at 6 h, and for 25-50% of metabolites across lipid classes at 0, 1, 3, and 8 h. The consistency of response within individuals was visualized by principal component analysis (PCA) and confirmed by ANOVA. Three representative metabolites that discriminated among the three individuals in the apolipoprotein B (ApoB) fraction, TG16:1n7, TG18:2n6, and PC18:3n3, are discussed in detail. The postprandial responses of individuals were unique within metabolites that were individual discriminators (ID) of metabolic phenotype. This study shows that the targeted metabolomic measurement of individual metabolic phenotype in response to a specially formulated lipid challenge is possible even without lead-in periods, dietary and lifestyle control, or intervention over a 3-month period in healthy free-living individuals.
Figures
Similar articles
-
Prolonged monitoring of postprandial lipid metabolism after a western meal rich in linoleic acid and carbohydrates.Appl Physiol Nutr Metab. 2019 Nov;44(11):1189-1198. doi: 10.1139/apnm-2018-0798. Epub 2019 Mar 20. Appl Physiol Nutr Metab. 2019. PMID: 30893569
-
Translational Metabolomics of Head Injury: Exploring Dysfunctional Cerebral Metabolism with Ex Vivo NMR Spectroscopy-Based Metabolite Quantification.In: Kobeissy FH, editor. Brain Neurotrauma: Molecular, Neuropsychological, and Rehabilitation Aspects. Boca Raton (FL): CRC Press/Taylor & Francis; 2015. Chapter 25. In: Kobeissy FH, editor. Brain Neurotrauma: Molecular, Neuropsychological, and Rehabilitation Aspects. Boca Raton (FL): CRC Press/Taylor & Francis; 2015. Chapter 25. PMID: 26269925 Free Books & Documents. Review.
-
Meal frequency; does it determine postprandial lipaemia?Eur J Clin Nutr. 1996 Aug;50(8):491-7. Eur J Clin Nutr. 1996. PMID: 8863008 Clinical Trial.
-
Use of manufactured foods enriched with fish oils as a means of increasing long-chain n-3 polyunsaturated fatty acid intake.Br J Nutr. 1997 Aug;78(2):223-36. doi: 10.1079/bjn19970142. Br J Nutr. 1997. PMID: 9301413 Clinical Trial.
-
Folic acid supplementation and malaria susceptibility and severity among people taking antifolate antimalarial drugs in endemic areas.Cochrane Database Syst Rev. 2022 Feb 1;2(2022):CD014217. doi: 10.1002/14651858.CD014217. Cochrane Database Syst Rev. 2022. PMID: 36321557 Free PMC article.
Cited by
-
Nutritional lipidomics: molecular metabolism, analytics, and diagnostics.Mol Nutr Food Res. 2013 Aug;57(8):1319-35. doi: 10.1002/mnfr.201200808. Epub 2013 Jul 1. Mol Nutr Food Res. 2013. PMID: 23818328 Free PMC article. Review.
-
A preliminary report on oral fat tolerance test in rhesus monkeys.Lipids Health Dis. 2014 Jan 10;13:11. doi: 10.1186/1476-511X-13-11. Lipids Health Dis. 2014. PMID: 24410972 Free PMC article.
-
Metabolomic profiles of plasma, exhaled breath condensate, and saliva are correlated with potential for air toxics detection.J Breath Res. 2017 Dec 6;12(1):016008. doi: 10.1088/1752-7163/aa863c. J Breath Res. 2017. PMID: 28808178 Free PMC article.
-
Wearable Technology to Quantify the Nutritional Intake of Adults: Validation Study.JMIR Mhealth Uhealth. 2020 Jul 22;8(7):e16405. doi: 10.2196/16405. JMIR Mhealth Uhealth. 2020. PMID: 32706729 Free PMC article.
-
Revealing static and dynamic biomarkers from postprandial metabolomics data through coupled matrix and tensor factorizations.Metabolomics. 2024 Jul 27;20(4):86. doi: 10.1007/s11306-024-02128-9. Metabolomics. 2024. PMID: 39066850
References
-
- Berry SE, Miller GJ, Sanders TA. The solid fat content of stearic acid-rich fats determines their postprandial effects. The American Journal of Clinical Nutrition. 2007;85(6):1486–1494. - PubMed
Grants and funding
LinkOut - more resources
Full Text Sources
Miscellaneous