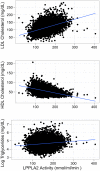
Genome-wide association study of Lp-PLA(2) activity and mass in the Framingham Heart Study
- PMID: 20442857
- PMCID: PMC2861686
- DOI: 10.1371/journal.pgen.1000928
Genome-wide association study of Lp-PLA(2) activity and mass in the Framingham Heart Study
Abstract
Lipoprotein-associated phospholipase A(2) (Lp-PLA(2)) is an emerging risk factor and therapeutic target for cardiovascular disease. The activity and mass of this enzyme are heritable traits, but major genetic determinants have not been explored in a systematic, genome-wide fashion. We carried out a genome-wide association study of Lp-PLA(2) activity and mass in 6,668 Caucasian subjects from the population-based Framingham Heart Study. Clinical data and genotypes from the Affymetrix 550K SNP array were obtained from the open-access Framingham SHARe project. Each polymorphism that passed quality control was tested for associations with Lp-PLA(2) activity and mass using linear mixed models implemented in the R statistical package, accounting for familial correlations, and controlling for age, sex, smoking, lipid-lowering-medication use, and cohort. For Lp-PLA(2) activity, polymorphisms at four independent loci reached genome-wide significance, including the APOE/APOC1 region on chromosome 19 (p = 6 x 10(-24)); CELSR2/PSRC1 on chromosome 1 (p = 3 x 10(-15)); SCARB1 on chromosome 12 (p = 1x10(-8)) and ZNF259/BUD13 in the APOA5/APOA1 gene region on chromosome 11 (p = 4 x 10(-8)). All of these remained significant after accounting for associations with LDL cholesterol, HDL cholesterol, or triglycerides. For Lp-PLA(2) mass, 12 SNPs achieved genome-wide significance, all clustering in a region on chromosome 6p12.3 near the PLA2G7 gene. Our analyses demonstrate that genetic polymorphisms may contribute to inter-individual variation in Lp-PLA(2) activity and mass.
Conflict of interest statement
The authors have declared that no competing interests exist.
Figures


Similar articles
-
Genome-wide association study evaluating lipoprotein-associated phospholipase A2 mass and activity at baseline and after rosuvastatin therapy.Circ Cardiovasc Genet. 2012 Dec;5(6):676-85. doi: 10.1161/CIRCGENETICS.112.963314. Epub 2012 Nov 1. Circ Cardiovasc Genet. 2012. PMID: 23118302 Clinical Trial.
-
Clinical and genetic factors associated with lipoprotein-associated phospholipase A2 in the Framingham Heart Study.Atherosclerosis. 2009 Jun;204(2):601-7. doi: 10.1016/j.atherosclerosis.2008.10.030. Epub 2008 Nov 5. Atherosclerosis. 2009. PMID: 19135199 Free PMC article.
-
[Impact of gender on lipoprotein-associated phospholipase A2 activity and association with known cardiovascularrisk factors].Zhonghua Xin Xue Guan Bing Za Zhi. 2013 Nov;41(11):962-7. Zhonghua Xin Xue Guan Bing Za Zhi. 2013. PMID: 24370228 Chinese.
-
Consensus panel recommendation for incorporating lipoprotein-associated phospholipase A2 testing into cardiovascular disease risk assessment guidelines.Am J Cardiol. 2008 Jun 16;101(12A):51F-57F. doi: 10.1016/j.amjcard.2008.04.019. Am J Cardiol. 2008. PMID: 18549872 Review.
-
Effects of dietary factors on lipoprotein-associated phospholipase A(2) (Lp-PLA (2)).Curr Atheroscler Rep. 2011 Dec;13(6):461-6. doi: 10.1007/s11883-011-0201-4. Curr Atheroscler Rep. 2011. PMID: 21870060 Review.
Cited by
-
Novel genetic variants associated with lumbar disc degeneration in northern Europeans: a meta-analysis of 4600 subjects.Ann Rheum Dis. 2013 Jul;72(7):1141-8. doi: 10.1136/annrheumdis-2012-201551. Epub 2012 Sep 19. Ann Rheum Dis. 2013. PMID: 22993228 Free PMC article.
-
MARV: a tool for genome-wide multi-phenotype analysis of rare variants.BMC Bioinformatics. 2017 Feb 16;18(1):110. doi: 10.1186/s12859-017-1530-2. BMC Bioinformatics. 2017. PMID: 28209135 Free PMC article.
-
An association study between genetic polymorphisms related to lipoprotein-associated phospholipase A(2) and coronary heart disease.Exp Ther Med. 2013 Mar;5(3):742-750. doi: 10.3892/etm.2013.911. Epub 2013 Jan 21. Exp Ther Med. 2013. PMID: 23404648 Free PMC article.
-
Tag-SNPs in Phospholipase-Related Genes Modify the Susceptibility to Nephrosclerosis and its Associated Cardiovascular Risk.Front Pharmacol. 2022 May 2;13:817020. doi: 10.3389/fphar.2022.817020. eCollection 2022. Front Pharmacol. 2022. PMID: 35586043 Free PMC article.
-
Selecting instruments for Mendelian randomization in the wake of genome-wide association studies.Int J Epidemiol. 2016 Oct;45(5):1600-1616. doi: 10.1093/ije/dyw088. Epub 2016 Jun 24. Int J Epidemiol. 2016. PMID: 27342221 Free PMC article.
References
-
- Persson M, Nilsson JA, Nelson JJ, Hedblad B, Berglund G. The epidemiology of Lp-PLA(2): distribution and correlation with cardiovascular risk factors in a population-based cohort. Atherosclerosis. 2007;190:388–396. - PubMed
-
- Koenig W, Khuseyinova N. Lipoprotein-Associated and Secretory Phospholipase A2 in Cardiovascular Disease: The Epidemiological Evidence. Cardiovasc Drugs Ther. 2009;23:85–92. - PubMed
-
- Wilensky RL, Macphee CH. Lipoprotein-associated phospholipase A(2) and atherosclerosis. Curr Opin Lipidol. 2009;20:415–420. - PubMed
-
- Stafforini DM. Biology of platelet-activating factor acetylhydrolase (PAF-AH, lipoprotein associated phospholipase A2). Cardiovasc Drugs Ther. 2009;23:73–83. - PubMed
-
- Tsimihodimos V, Karabina SA, Tambaki AP, Bairaktari E, Miltiadous G, et al. Altered distribution of platelet-activating factor- acetylhydrolase activity between LDL and HDL as a function of the severity of hypercholesterolemia. J Lipid Res. 2002;43:256–263. - PubMed
Publication types
MeSH terms
Substances
Grants and funding
LinkOut - more resources
Full Text Sources
Other Literature Sources
Miscellaneous

