. 2010 Apr 29;6(4):e1000891.
doi: 10.1371/journal.ppat.1000891.

Complement as an endogenous adjuvant for dendritic cell-mediated induction of retrovirus-specific CTLs

Affiliations

Complement as an endogenous adjuvant for dendritic cell-mediated induction of retrovirus-specific CTLs

Zoltán Bánki et al. PLoS Pathog. .

Abstract

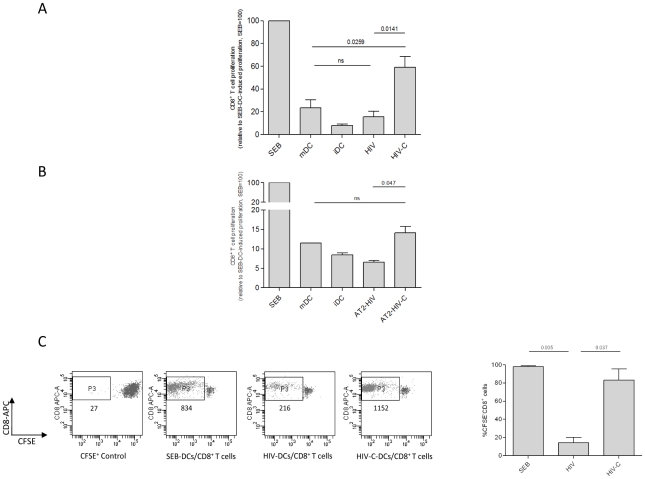
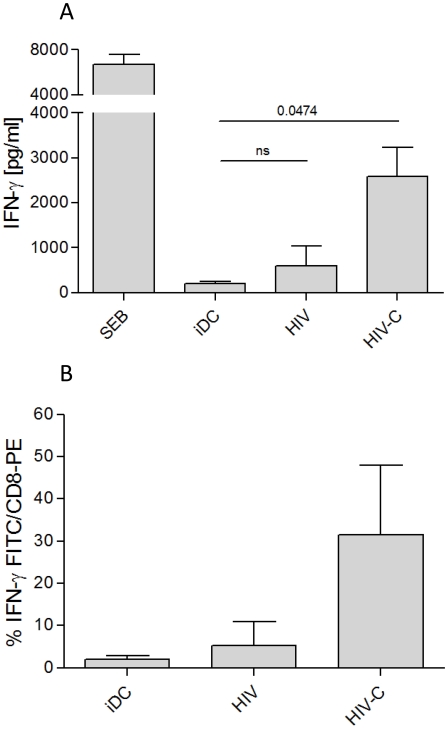
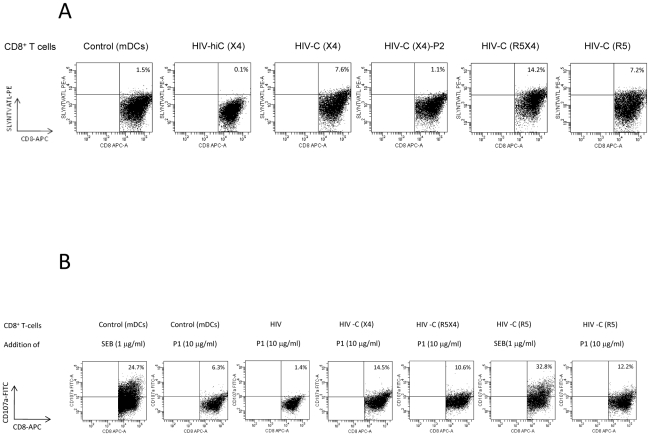
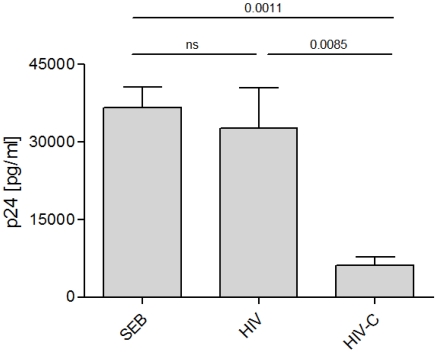
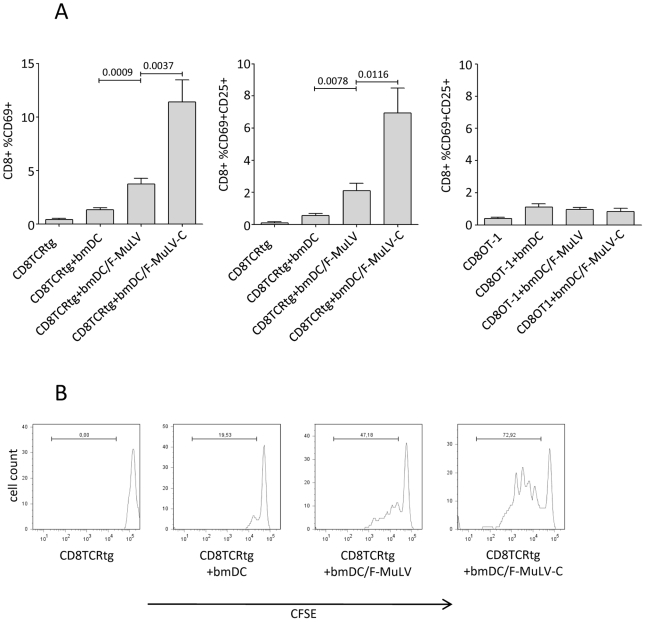
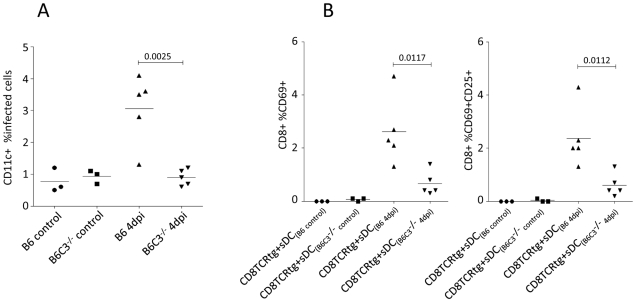
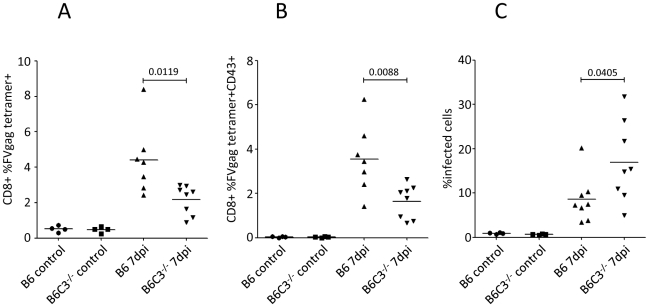
Previous studies have demonstrated the involvement of complement (C) in induction of efficient CTL responses against different viral infections, but the exact role of complement in this process has not been determined. We now show that C opsonization of retroviral particles enhances the ability of dendritic cells (DCs) to induce CTL responses both in vitro and in vivo. DCs exposed to C-opsonized HIV in vitro were able to stimulate CTLs to elicit antiviral activity significantly better than non-opsonized HIV. Furthermore, experiments using the Friend virus (FV) mouse model illustrated that the enhancing role of complement on DC-mediated CTL induction also occurred in vivo. Our results indicate that complement serves as natural adjuvant for DC-induced expansion and differentiation of specific CTLs against retroviruses.


Conflict of interest statement

The authors have declared that no competing interests exist.

Figures

Figure 1
Figure 1. Proliferation of HIV-C-DC-primed CD8+ T cells.
Complement-opsonization of HIV (A) or AT2-inactivated HIV (B) and subsequent loading of DCs initiates proliferation of CD8+ T cells as measured by counting CD8+ T cells over a one minute period of time (A) and by CFSE-staining of CD8+ T cells (C). As positive control, DCs were exposed to the superantigen SEB, which induced strong proliferation of CD8+ T cells. The response to SEB was set at 100%. (A) No or low proliferation comparable to iDC-primed CD8+ T cells was mediated by DCs exposed to non-opsonized HIV (HIV). Cytokine-stimulated mDC-primed CD8+ T cells showed low proliferation, while HIV-C-exposed DCs induced about 60% proliferation compared to SEB-DC-primed CD8+ T cells. Columns represent mean values of CD8+ T cells from 5 donors stimulated with either BaL or 92UG037. Data were analyzed by unpaired Student's t-test. (B) Prime-boosting by AT2-HIV-C-loaded DCs caused proliferation of autologous CD8+ T cells, albeit weaker than with HIV-C-exposed DCs. In contrast, DCs loaded with AT2-HIV did not induce proliferation of CD8+ T cells at all. This was repeated four times with HIV strains 92BR030 or 92UG037. (C) Complement-mediated proliferation of CD8+ T cells was confirmed with 5 donors by staining cells with 2.5 µM CFSE prior addition of loaded DCs (n = 5). Left panel: dot plot of CD8+ T cells exposed three times to SEB-, HIV- or HIV-C-loaded DCs, and a CFSE+ control. The amount of cells in the live CD8high population (P3) is shown in the dot plot for one representative donor. Right panel: mean percentages of CFSE [proliferated]/CD8+ T cells of SEB-, HIV- or HIV-C-DC-primed CD8+ T cells from 5 donors. Data were analyzed by unpaired Student's t-test.
Figure 2
Figure 2. IFN-γ secretion of HIV-C-DC-primed CD8+ T cells.
IFN-γ secretion by CD8+ T cells was measured by OPTEia (A) or by an IFN-γ secretion assay (B) following the second boost with DCs exposed to LPS or differentially opsonized HIV-1 preparations as indicated. iDC-primed CD8+ T cells were used as negative control for IFN-γ secretion. HIV-C-DCs but not HIV-DCs also induced IFN-γ secretion by CD8+ T cells following the third boost (not shown). SEB-DCs induced high IFN-γ secretion of CD8+ T cells (A). In A, bars represent means (+SD) from four different CD8+ T cell donors stimulated with DCs exposed to differentially opsonized R5- or X4-tropic HIV (92BR030, BaL, NL4-3). In B, bars represent mean percentages of IFN-γ-secreting CD8+ T cells after re-stimulation with iDCs or DCs exposed to HIV or HIV-C (BaL, 92BR030). The IFN-γ-secretion assay was performed with T cells from 5 different donors and data were analyzed by unpaired Student's t-test.
Figure 3
Figure 3. Specificity and degranulation of HIV-C-DC-primed CTLs.
(A) Analysis of the specificity of the in vitro generated CTLs by tetramer analyses. Dead cells were excluded from analyses by 7-AAD staining and FACS plots were gated on CD8high T cell populations. The panel of dot plots shows the specificity by SLYNTVATL-PE tetramer staining (HLA-A02). In A, the top line (CD8+ T cells) refers to what the cells were primed with. For negative controls CD8+ T cells were primed with cytokine-stimulated mDCs and re-stimulated with the HIV(HLA-A02)-specific peptide P1 (Control (mDCs)). As expected, these controls showed only low reactivity with the tetramer (1.5%). Also HIV-hiC-DC-primed CD8+ T cells did not recognize the tetramer (HIV-hiC(X4), 0.1%). The percentages of tetramer-positive CD8+ T cells cells are outlined in the Figure and only HIV-C-DC-primed CD8+ T cells re-stimulated with P1 stained tetramer positive independently of the tropism of the virus used for DC stimulation (HIV-C(X4), HIV-C(R5X4), HIV-C(R5)). 1.1% of HIV-C-DC-CD8+ T cells re-stimulated with the control peptide P2 (HIV-C(X4)-P2) were SLYNTVATL-positive comparable to mDC-primed CD8+ T cells (HIV-C(X4)-P2). This figure shows a representative tetramer analysis from one donor and three different virus strains (NL4-3, 93BR020, 92BR030). Tetramer analysis was performed 4 times. (B) Degranulation of HIV-C-DC-primed CTLs. Degranulation was measured by detection of cell surface CD107a after four hours of stimulation with specific peptides as indicated. Cells were gated on live, CD8high populations. SEB-stimulated mDC- or HIV-C(R5)-primed CD8+ T cells were used as positive control for degranulation. The top line (CD8+ T cells) refers to what the cells were primed with and the bottom line (Addition of) to what they were stimulated with (SEB or peptide P1) and the percentages of CD107a-positive cells are outlined in the figure. Beside SEB, only HIV-C-DC-primed CD8+ T cells degranulated upon specific stimulation with P1 independently on the tropism of the virus used (HIV-C(X4)/P1, HIV-C(R5X4)/P1, HIV-C(R5)/P1). Degranulation was measured concomitantly with tetramer analysis and repeated 4 times.
Figure 4
Figure 4. HIV-C-DC-primed CD8+ T cells elicit antiviral effects.
Inhibition of HIV p24 production by infected autologous CD4+ T cells was monitored after incubation with variously stimulated CD8+ T cells. Mean p24 values of triplicates (+SD) from one donor on day 11 post addition of HIV-specific CD8+ T cells to NL4-3-incubated CD4+ T cells are shown. Inhibition by HIV-C-DC-primed CD8+ T cells was significantly greater than CD8+ T cells primed with non-opsonized HIV (p = 0.0085). Similar results were obtained with cells isolated from 7 different donors using R5-, X4- and R5X4-tropic viral isolates, BaL, 92BR030, 92UG037, NL4-3, 93BR020 (data not shown). A summary of all data in one graph was not feasible due to donor- and virus strain-dependent differences in the infection efficiency, therefore p24 values of one representative donor is shown in this figure.
Figure 5
Figure 5. Complement enhances F-MuLV infection of bmDCs and induces activation and proliferation of FV-specific CD8+ T cells by virus-loaded DCs.
(A) Bars indicate mean percentages of CD8+ T cells expressing activation markers following stimulation as indicated on the X axis (expression of CD69, left panel; dual expression of CD69 and CD25, middle and right panels). The left two panels show data from virus-specific CD8+ T cells while the right panel shows data from non-specific (OT-1) negative control cells. Data were analyzed by unpaired students t-test, n = 10. (B) CFSE dilution as measured by flow cytometry was used to analyze proliferation of TCRtg CD8+ T cells in response to variously loaded DCs. Data are from one representative of three independent experiments.
Figure 6
Figure 6. Spleen DCs from FV-infected C3-deficient mice show an impaired capacity to induce FV-specific CTL.
(A) Infection of CD11c+ spleen DCs were analyzed by flow-cytometry from non- and FV-infected B6 wt and C3−/− mice at 4 dpi by expression of viral glycosylated gag protein using mAb clone 34. (B) Isolated sDC from non-infected controls (B6 control and B6 C3−/− control) and FV-infected (B6 4 dpi and B6 C3−/− 4 dpi) animals were co-cultured with FV-specific TCRtg CD8+ T cells for 24 hours and the activation of FV-specific CTLs was determined by measuring cell-surface expression of CD69 and CD25 on TCRtg CD8+ T cells (expression of CD69, left panel; dual expression of CD69 and CD25, right panel). Data were analyzed by unpaired Student's t-test.
Figure 7
Figure 7. Pronounced FV-infection in C3-deficient mice correlates with a lower frequency of FV-specific CTLs.
B6 wt and B6 C3−/− mice were infected with 10000 SFFU of theFV-complex. (A) Splenic CD8+ T cells were analyzed for FV specificity using gag-specific tetramers. (B) Tetramer positive CD8+ T cells were analyzed for expression of the effector cell marker CD43. (C) FV-infection of spleen cells was monitored by FACS analysis using mAb clone 34. Data were analyzed by unpaired Student's t-test.

Similar articles

Cited by

References

    1. Pantaleo G, Demarest JF, Soudeyns H, Graziosi C, Denis F, et al. Major expansion of CD8+ T cells with a predominant V beta usage during the primary immune response to HIV. Nature. 1994;370:463–467. - PubMed
    1. Borrow P, Lewicki H, Hahn BH, Shaw GM, Oldstone MB. Virus-specific CD8+ cytotoxic T-lymphocyte activity associated with control of viremia in primary human immunodeficiency virus type 1 infection. J Virol. 1994;68:6103–6110. - PMC - PubMed
    1. Koup RA, Safrit JT, Cao Y, Andrews CA, McLeod G, et al. Temporal association of cellular immune responses with the initial control of viremia in primary human immunodeficiency virus type 1 syndrome. J Virol. 1994;68:4650–4655. - PMC - PubMed
    1. McMichael AJ, Rowland-Jones SL. Cellular immune responses to HIV. Nature. 2001;410:980–987. - PubMed
    1. Deeks SG, Walker BD. Human immunodeficiency virus controllers: mechanisms of durable virus control in the absence of antiretroviral therapy. Immunity. 2007;27:406–416. - PubMed

Publication types

Substances