. 2010 May;11(5):332-41.
doi: 10.1631/jzus.B0900310.

Analysis of genetic diversity in banana cultivars (Musa cvs.) from the South of Oman using AFLP markers and classification by phylogenetic, hierarchical clustering and principal component analyses

Affiliations

Analysis of genetic diversity in banana cultivars (Musa cvs.) from the South of Oman using AFLP markers and classification by phylogenetic, hierarchical clustering and principal component analyses

Umezuruike Linus Opara et al. J Zhejiang Univ Sci B. 2010 May.

Abstract

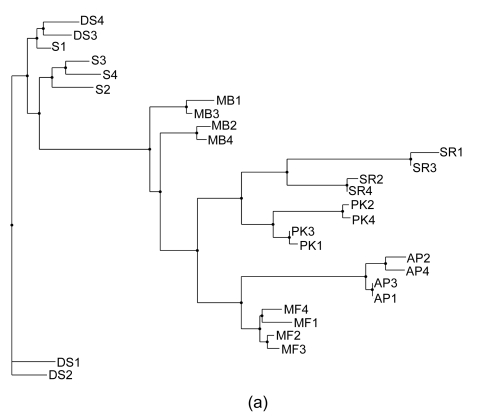
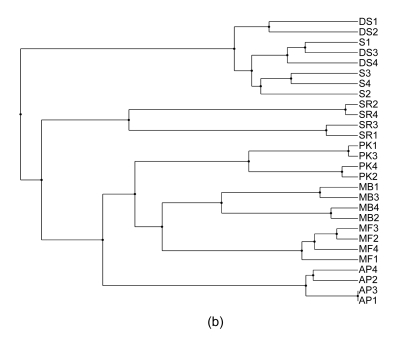
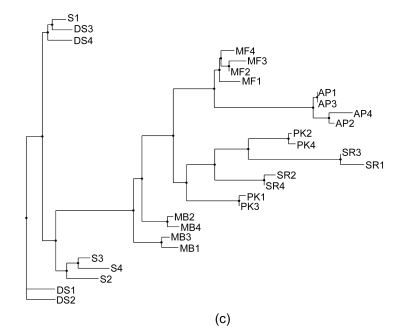
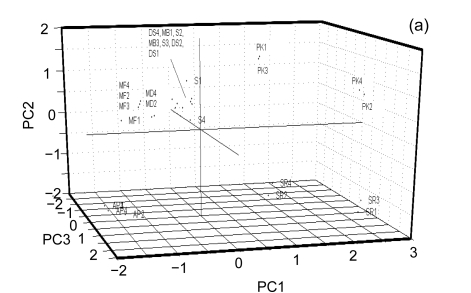
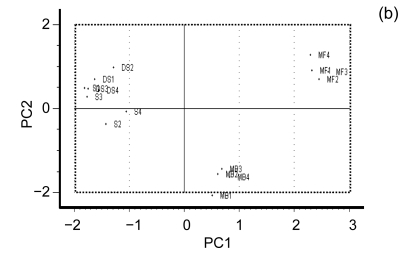
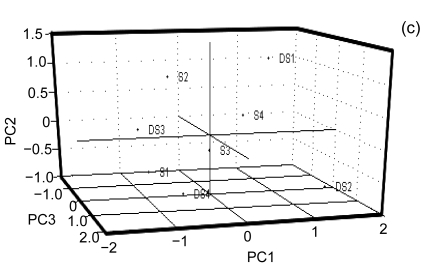
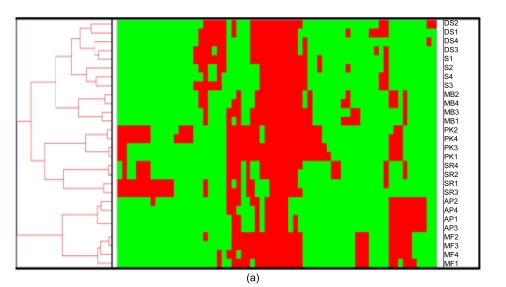
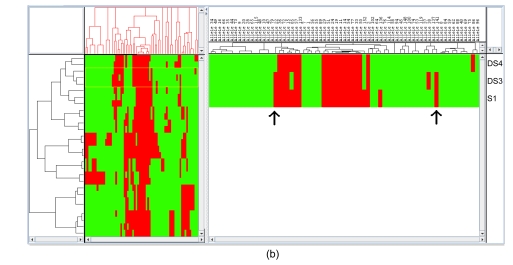
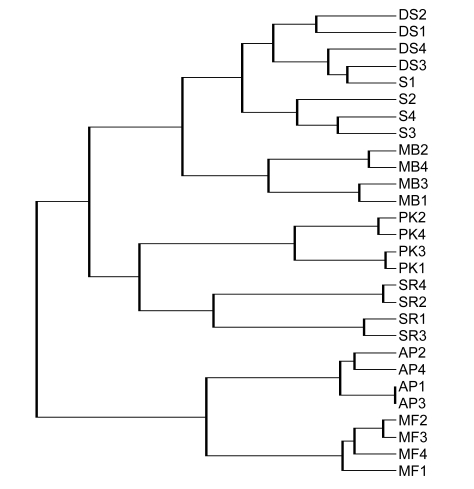
Banana is an important crop grown in Oman and there is a dearth of information on its genetic diversity to assist in crop breeding and improvement programs. This study employed amplified fragment length polymorphism (AFLP) to investigate the genetic variation in local banana cultivars from the southern region of Oman. Using 12 primer combinations, a total of 1094 bands were scored, of which 1012 were polymorphic. Eighty-two unique markers were identified, which revealed the distinct separation of the seven cultivars. The results obtained show that AFLP can be used to differentiate the banana cultivars. Further classification by phylogenetic, hierarchical clustering and principal component analyses showed significant differences between the clusters found with molecular markers and those clusters created by previous studies using morphological analysis. Based on the analytical results, a consensus dendrogram of the banana cultivars is presented.


Figures

Fig. 1
Fig. 1
Consensus phylogenetic trees generated with Fitch, Kitsch, and Neighbor Joining methods. (a) Fitch method estimates phylogenies from distance matrix data under the “additive tree model” according to which the distances are expected to equal the sums of branch lengths between the species; (b) Kitsch method estimates phylogenies from distance matrix data under the “ultrametric” model which is the same as the additive tree model except that an evolutionary clock is assumed; (c) Neighbor Joining is a distance matrix method producing an unrooted tree without the assumption of a clock (Felsenstein, 1989)
Fig. 1
Fig. 1
Consensus phylogenetic trees generated with Fitch, Kitsch, and Neighbor Joining methods. (a) Fitch method estimates phylogenies from distance matrix data under the “additive tree model” according to which the distances are expected to equal the sums of branch lengths between the species; (b) Kitsch method estimates phylogenies from distance matrix data under the “ultrametric” model which is the same as the additive tree model except that an evolutionary clock is assumed; (c) Neighbor Joining is a distance matrix method producing an unrooted tree without the assumption of a clock (Felsenstein, 1989)
Fig. 2
Fig. 2
Principal component analysis (PCA). (a) Overview of the genotyping data of all the samples projected onto the first three principle components. PK1 and PK3 are closely related as are PK2 and PK4. Similarly SR1 and SR3 cluster cleanly together as do SR2 and SR4. AP1–AP4 clearly cluster together with AP1 and AP3 clustering exactly together; (b) The closely related region isolated and projected onto the two principal components. MF1–MF4 cluster cleanly as do MB1–MB4. The phylogenetic trees show some ambiguity amongst them as to which cultivars within these subgroups are most closely related. The PCA gives a better spatial sense of the relationships within these subgroups. For example it is clear that MB2, MB3 and MB4 are quite closely related to one another whereas MB1, although closely related, clearly differs from the other three; (c) The most closely related banana cultivars projected onto the first three principal components. This is the area that shows the highest degree of ambiguity amongst the phylogenetic trees. From the multivariate analysis it is clear why there is ambiguity as these cultivars are closely related to one another as compared to other cultivars but amongst themselves are relatively evenly distributed throughout the principal component space. A further examination of the data accounting for this would be helpful. This is possible with hierarchical clustering analysis as seen in Fig. 3
Fig. 2
Fig. 2
Principal component analysis (PCA). (a) Overview of the genotyping data of all the samples projected onto the first three principle components. PK1 and PK3 are closely related as are PK2 and PK4. Similarly SR1 and SR3 cluster cleanly together as do SR2 and SR4. AP1–AP4 clearly cluster together with AP1 and AP3 clustering exactly together; (b) The closely related region isolated and projected onto the two principal components. MF1–MF4 cluster cleanly as do MB1–MB4. The phylogenetic trees show some ambiguity amongst them as to which cultivars within these subgroups are most closely related. The PCA gives a better spatial sense of the relationships within these subgroups. For example it is clear that MB2, MB3 and MB4 are quite closely related to one another whereas MB1, although closely related, clearly differs from the other three; (c) The most closely related banana cultivars projected onto the first three principal components. This is the area that shows the highest degree of ambiguity amongst the phylogenetic trees. From the multivariate analysis it is clear why there is ambiguity as these cultivars are closely related to one another as compared to other cultivars but amongst themselves are relatively evenly distributed throughout the principal component space. A further examination of the data accounting for this would be helpful. This is possible with hierarchical clustering analysis as seen in Fig. 3
Fig. 3
Fig. 3
Hierarchical clustering analysis (HCA). (a) HCA of all of the samples. This largely confirms the groupings made by both phylogenetic and multivariate statistical methods; (b) “Zoom view” of a branch in the cluster. In the samples shown to be the most ambiguous by phylogenetic analysis and PCA, HCA analysis shows that only seven fragments distinguish them from one another. One can see the specific effects of band’s presence or absence on the clustering of S1, DS3 and DS4. It would appear that S1 and DS3 share two fragments (see arrows) more than do DS3 and DS4 and as such, the correct grouping would be to show S1 and DS3 in the same clade
Fig. 3
Fig. 3
Hierarchical clustering analysis (HCA). (a) HCA of all of the samples. This largely confirms the groupings made by both phylogenetic and multivariate statistical methods; (b) “Zoom view” of a branch in the cluster. In the samples shown to be the most ambiguous by phylogenetic analysis and PCA, HCA analysis shows that only seven fragments distinguish them from one another. One can see the specific effects of band’s presence or absence on the clustering of S1, DS3 and DS4. It would appear that S1 and DS3 share two fragments (see arrows) more than do DS3 and DS4 and as such, the correct grouping would be to show S1 and DS3 in the same clade
Fig. 4
Fig. 4
Consensus tree diagram of the genetic relationships between the banana cultivars

Similar articles

Cited by

References

    1. Allaby RG, Brown TA. AFLP data and the origins of domesticated crops. Genome. 2003;46(3):448–453. doi: 10.1139/g03-025. - DOI - PubMed
    1. Bhat KV, Jarret RL, Rana RS. DNA profiling of banana and plantain cultivars using random amplified polymorphic DNA (RAPD) and restriction fragment length polymorphism (RFLP) markers. Electrophoresis. 1995;16(1):1736–1745. doi: 10.1002/elps.11501601287. - DOI - PubMed
    1. Bhat KV, Amaravathi Y, Guatam PL, Velayudhan KC. AFLP characterization and genetic diversity analysis of Indian banana and plantain cultivars (Musa spp.) Plant Genetic Resources. 2004;2(2):121–130. doi: 10.1079/PGR200440. - DOI
    1. de Langhe E. Banana Diversity in the Middle East (Jordan, Egypt and Oman) Montpellier, France: International Network for the Improvement of Banana and Plantain (INIBAP); 2002.
    1. Doyle JJ, Doyle JL. A rapid total DNA preparation procedure for fresh plant tissue. Focus. 1990;12:13–15.

Publication types

Substances