

Increasing computer-aided detection specificity by projection features for CT colonography
- PMID: 20443468
- PMCID: PMC2848845
- DOI: 10.1118/1.3302833
Increasing computer-aided detection specificity by projection features for CT colonography
Abstract
Purpose: A large number of false positives (FPs) generated by computer-aided detection (CAD) schemes is likely to distract radiologists' attention and decrease their interpretation efficiency. This study aims to develop projection-based features which characterize true and false positives to increase the specificity while maintaining high sensitivity in detecting colonic polyps.
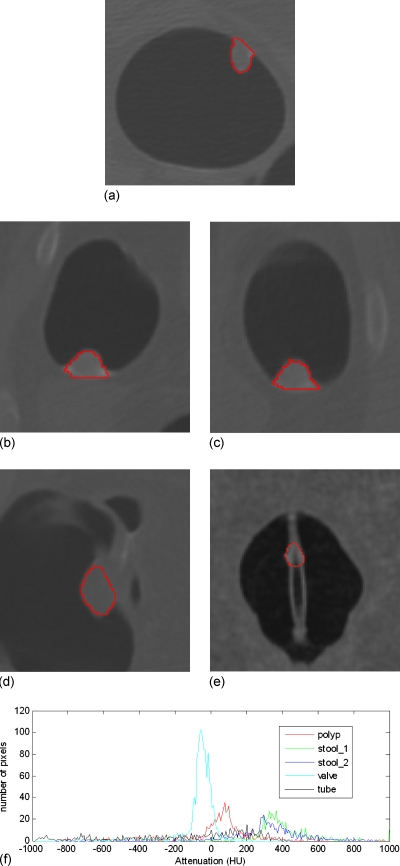
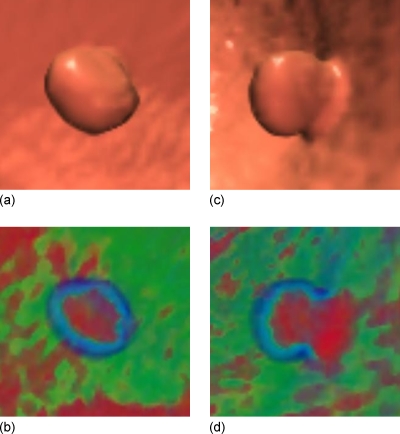
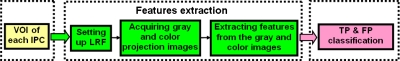
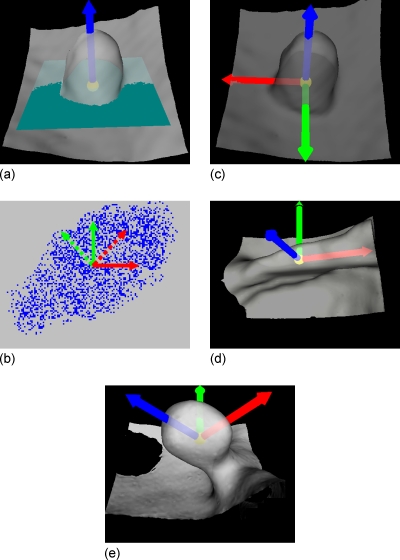
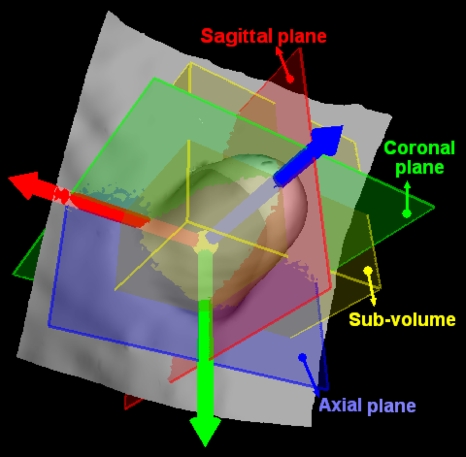
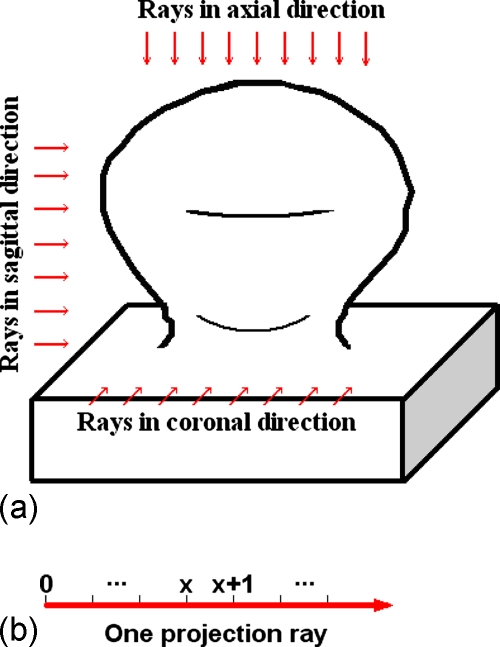
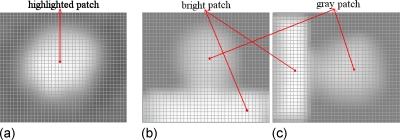
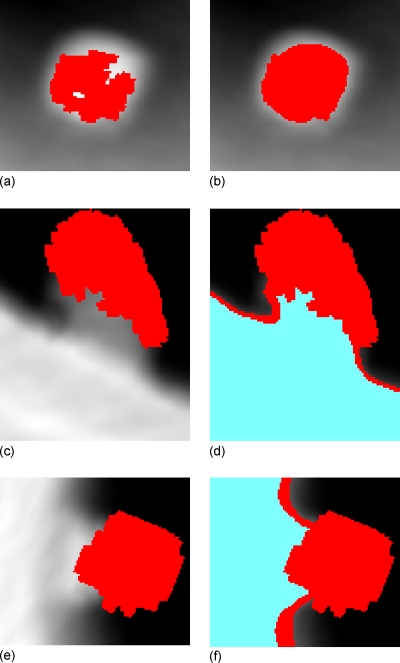
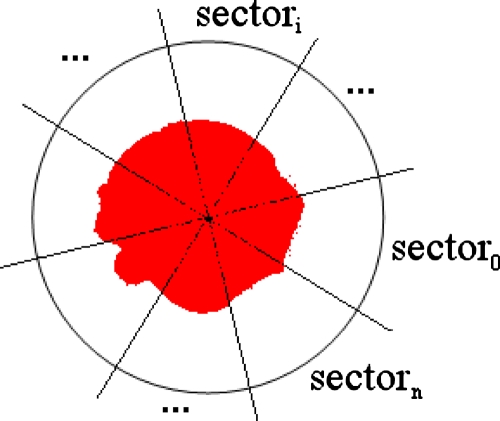
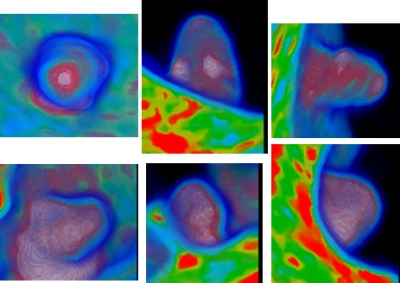
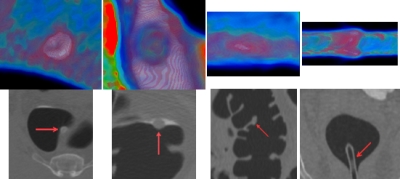
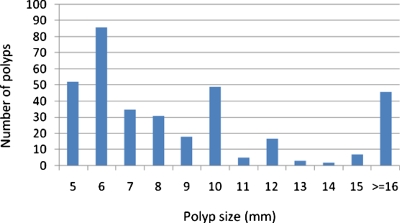
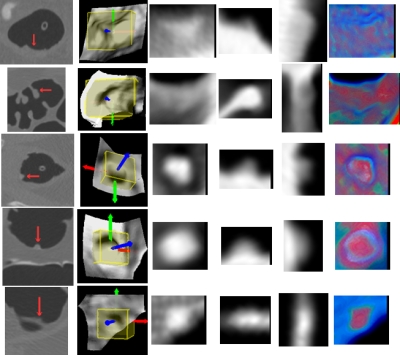
Methods: In this study, two-dimensional projection images are obtained from each initial polyp candidate or volume of interest, and features are extracted from both the gray and color projection images to differentiate FPs from true positives. These projection features were tested to exclude different types of FPs, such as haustral folds, rectal tubes, and residue stool using a database of 325 patient studies (from two different institutions), which includes 556 scans at supine and/or prone positions with 347 polyps and masses sized from 5 to 60 mm. For comparison, several well-established features were used to generate a baseline reference. The experimental evaluation was conducted for large polyps (> or = 10 mm) and medium-sized polyps (5-9 mm) separately.
Results: For large polyps, the additional usage of the projection features reduces the FP rate from 5.31 to 1.92 per scan at the comparable by-polyp sensitivity level of 93.1%. For medium-sized polyps, the FP rate is reduced from 8.89 to 5.23 at the sensitivity level of 80.6%. The percentages of FP reduction are 63.9% and 41.2% for the large and medium-sized polyps, respectively, without sacrificing detection sensitivity.
Conclusions: The results have demonstrated that the new projection features can effectively reduce the FPs and increase the detection specificity without sacrificing the sensitivity. CAD of colonic polyps is supposed to help radiologists to improve their performance in interpreting computed tomographic colonography images.
Figures


Similar articles
-
Mixture of expert 3D massive-training ANNs for reduction of multiple types of false positives in CAD for detection of polyps in CT colonography.Med Phys. 2008 Feb;35(2):694-703. doi: 10.1118/1.2829870. Med Phys. 2008. PMID: 18383691
-
A CAD of fully automated colonic polyp detection for contrasted and non-contrasted CT scans.Int J Comput Assist Radiol Surg. 2017 Apr;12(4):627-644. doi: 10.1007/s11548-017-1521-9. Epub 2017 Jan 18. Int J Comput Assist Radiol Surg. 2017. PMID: 28101760
-
CT colonography: advanced computer-aided detection scheme utilizing MTANNs for detection of "missed" polyps in a multicenter clinical trial.Med Phys. 2010 Jan;37(1):12-21. doi: 10.1118/1.3263615. Med Phys. 2010. PMID: 20175461 Free PMC article.
-
CT colonography with computer-aided detection: recognizing the causes of false-positive reader results.Radiographics. 2014 Nov-Dec;34(7):1885-905. doi: 10.1148/rg.347130053. Radiographics. 2014. PMID: 25384290 Free PMC article. Review.
-
Computer-aided diagnosis for CT colonography.Semin Ultrasound CT MR. 2004 Oct;25(5):419-31. doi: 10.1053/j.sult.2004.07.002. Semin Ultrasound CT MR. 2004. PMID: 15559125 Review.
Cited by
-
A review of computer-aided diagnosis in thoracic and colonic imaging.Quant Imaging Med Surg. 2012 Sep;2(3):163-76. doi: 10.3978/j.issn.2223-4292.2012.09.02. Quant Imaging Med Surg. 2012. PMID: 23256078 Free PMC article.
-
Matching 3-D prone and supine CT colonography scans using graphs.IEEE Trans Inf Technol Biomed. 2012 Jul;16(4):676-82. doi: 10.1109/TITB.2012.2194297. Epub 2012 Apr 27. IEEE Trans Inf Technol Biomed. 2012. PMID: 22552585 Free PMC article.
-
Strategies for improved interpretation of computer-aided detections for CT colonography utilizing distributed human intelligence.Med Image Anal. 2012 Aug;16(6):1280-92. doi: 10.1016/j.media.2012.04.007. Epub 2012 May 3. Med Image Anal. 2012. PMID: 22705287 Free PMC article.
-
Virtual colonoscopy vs optical colonoscopy.Expert Opin Med Diagn. 2010 Mar 1;4(2):159-169. doi: 10.1517/17530051003658736. Expert Opin Med Diagn. 2010. PMID: 20473367 Free PMC article.
-
Max-AUC feature selection in computer-aided detection of polyps in CT colonography.IEEE J Biomed Health Inform. 2014 Mar;18(2):585-93. doi: 10.1109/JBHI.2013.2278023. IEEE J Biomed Health Inform. 2014. PMID: 24608058 Free PMC article.
References
-
- American Cancer Society, Cancer Facts & Figures 2008 (American Cancer Society, Atlanta, 2008).
-
- Eddy D., “Screening for colorectal cancer,” Ann. Intern Med. ZZZZZZ 113, 373–384 (1990). - PubMed
-
- Gluecker T., Johnson C., Harmsen W., Offord K., Harris A., Wilson L., and Ahlquist D., “Colorectal cancer screening with CT colonography, colonoscopy, and double-contrast barium enema examination: Prospective assessment of patient perceptions and preferences,” Radiology RADLAX 227(2), 378–384 (2003).10.1148/radiol.2272020293 - DOI - PubMed
-
- Pickhardt P., Choi J., Hwang I., Butler J., Puckett M., Hildebrandt H., Wong R., Nugent P., Mysliwiec P., and Schindler W., “Computed tomographic virtual colonoscopy to screen for colorectal neoplasia in asymptomatic adults,” N. Engl. J. Med. NEJMAG 349(23), 2191–2200 (2003).10.1056/NEJMoa031618 - DOI - PubMed
Publication types
MeSH terms
Grants and funding
LinkOut - more resources
Full Text Sources
Medical
Miscellaneous
