

Review
doi: 10.1021/cr100023g.
Epub 2010 May 5.
Proton-coupled electron transfer in DNA on formation of radiation-produced ion radicals
Affiliations
- PMID: 20443634
- PMCID: PMC2947616
- DOI: 10.1021/cr100023g
Item in Clipboard
Review
Proton-coupled electron transfer in DNA on formation of radiation-produced ion radicals
Chem Rev.
.
No abstract available
Figures
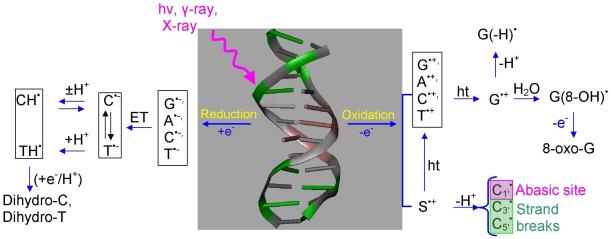
Schematic diagram showing major oxidation and reduction processes that occur in DNA during high energy radiation interaction with DNA. (HT = hole transfer; ET = electron transfer). Processes involving excited states and low energy electrons are not shown. The sketch is based on the works from refs. ,,,-, -.
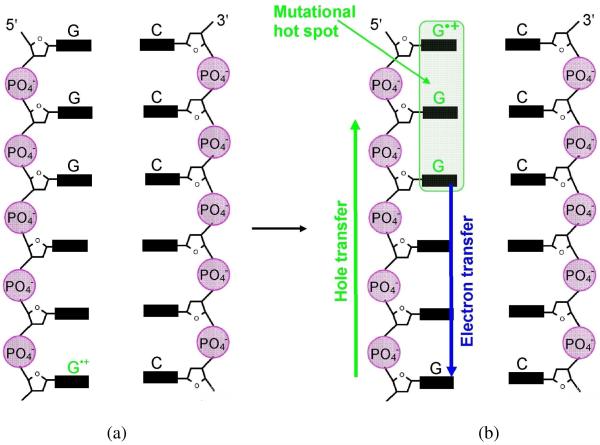
(a) One electron oxidation of G in DNA is followed by (b) hole transfer to a distant GGG (mutational hot spot). Figure based in part from Ref. . Hole localization is mainly at the 5′-G based on electron spin resonance measurements Ref. .
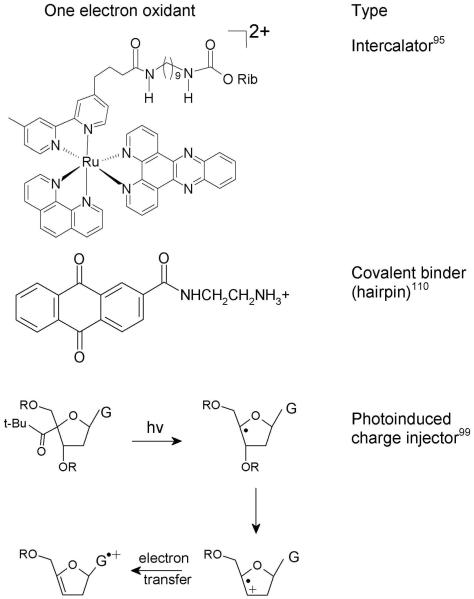
Structures of one electron oxidants (a) tethered ruthenium II derivative (b) anthraquinone derivative and (c) one electron oxidation of G by photolysis of tert-butyl ketone attached to C4′ site of sugar.
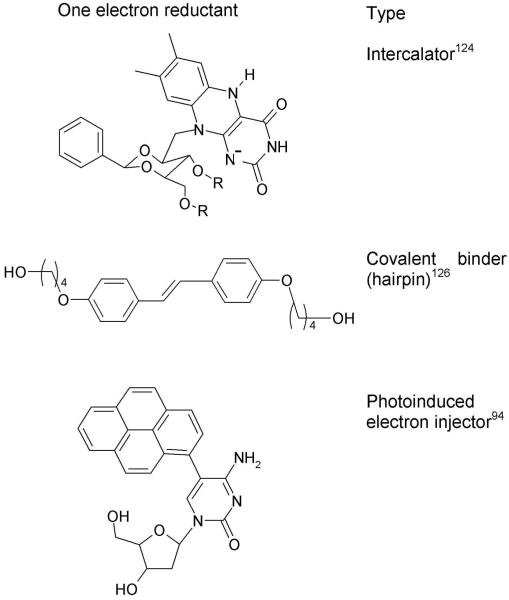
Structures of one electron reductants (a) riboflavin coenzyme nucleobase, (b) stilbenediether (SE) linkers and (c) Pyrene-modified nucleosides.
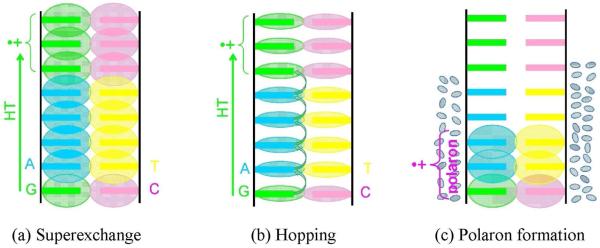
Proposed DNA-mediated charge transfer mechanisms; (a) Superexchange, the overlapping molecular orbitals (MOs) on the well stacked DNA bases provide a path for fast hole transfer, (b) Hopping, the MOs are localized on the DNA bases and the hole hops from one base to another, shown by arrows and (c) polaron formation occurs as solvent polarizes around DNA holes. This limits hole delocalization and transfer rates.
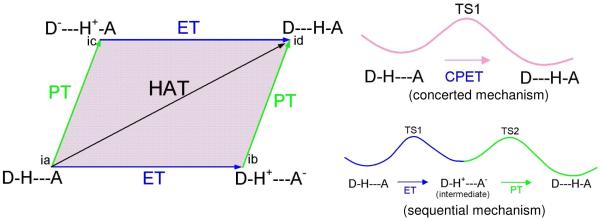
Schematic diagram showing stepwise (sequential) electron transfer and proton transfer (ET-PT or PT-ET) processes which proceed along the sides of the parallelogram. In ET-PT the reaction path has two transition states TS1 and TS2, right lower figure. The entire area of the parallelogram represents the proton coupled electron transfer (PCET) mechanism and the reaction has only one transition state (TS1), right upper figure. D-H is electron and proton donor and A is the acceptor. Figure based on Refs. , and .
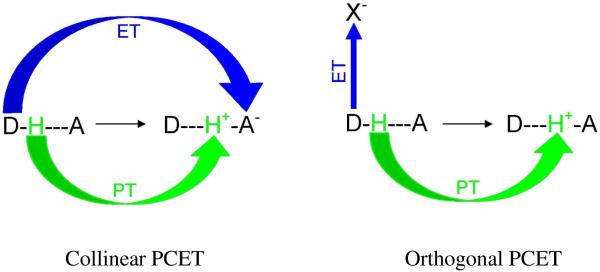
Collinear and orthogonal PCET. In collinear PCET, proton and electron transfer to the same acceptor site (A). In orthogonal or bidirectional PCET, proton and electron transfer to two different acceptor sites, X (electron acceptor) and A (proton acceptor).
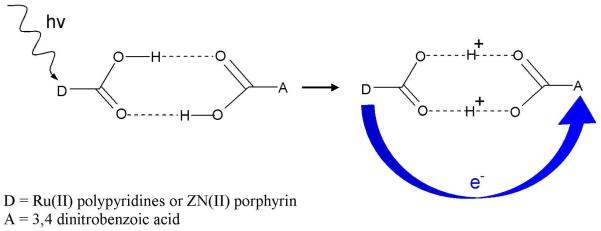
Donor (D) and acceptor (A) compounds for PCET experiment. The photoinduced electron transfer from D to A induces symmetric double proton transfer between D and A. The symmetric hydrogen-bonded interface produces minor charge rearrangement due to double proton exchange.
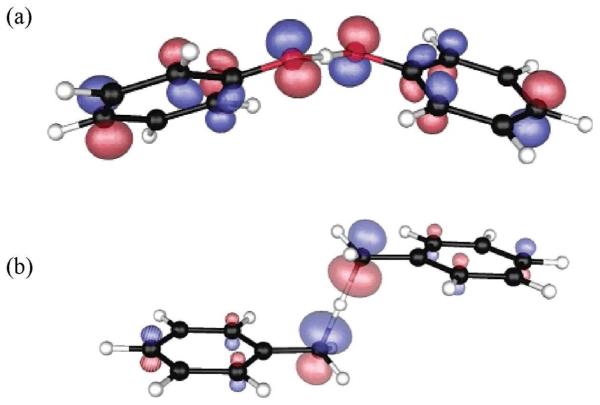
The singly occupied molecular orbital (SOMO) plot of (a) Phenoxyl radical-phenol (b) Benzyl radical-toluene at the transition state structure. Reactions (a) and (b) are identified as PCET and HAT, respectively. (Figure reproduced with permission from ref. . Copyright 2002 American Chemical Society.)
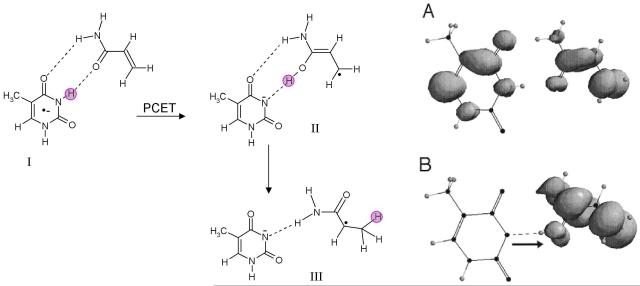
Optimized structures of thymine:acrylamide radical anion complexes, before and after proton transfer and their spin density distributions. (A) DFT spatial spin distribution for species I (before proton transfer). Note that the spin is shared over both the thymine and acrylamide structures at the isodensity of 0.002 e(Å)−3. (B) DFT spatial spin distribution for species II (after PCET) at the isodensity of 0.002 e(Å)−3. The pink circle highlights the transferring proton. (Figure 2 of ref. reproduced with permission. Copyright 2001 American Chemical Society.)
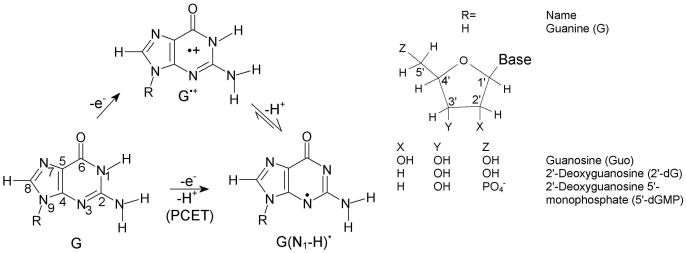
ET-PT (stepwise) and PCET reaction pathways for the oxidation of guanine.
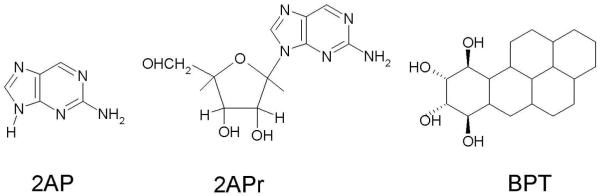
Structures of 2-aminopurine (2AP), 2-aminopurine ribose (2APr) and aromatic pyrenyl (BPT).,
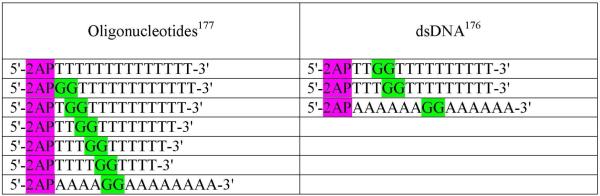
Design of 2AP modified oligonucleotides and DNA duplexes used in refs. , .
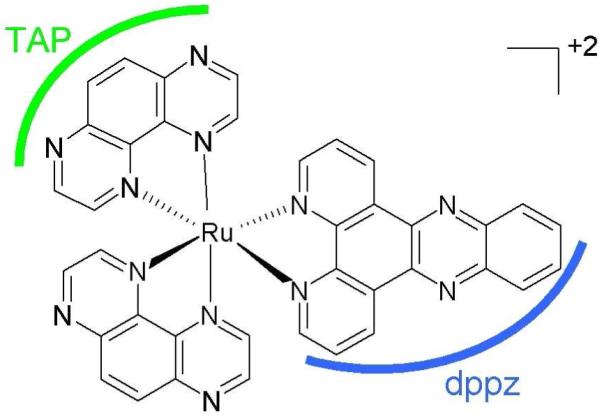
Structure of [Ru(TAP)2(dppz)]2+ ref. .
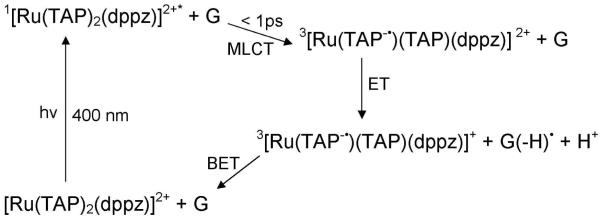
Formation of the MLCT excited state of [Ru(TAP)2(dppz)]2+ and ET from G to form G(−H)• via PCET. See refs. , .
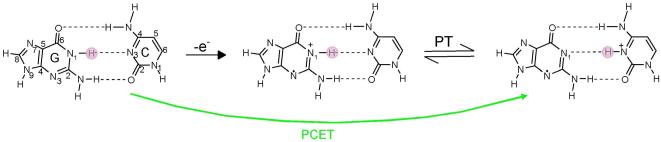
Scheme showing prototropic equilibria of proton transfer in one electron oxidized G-C base pair. One electron oxidation of G-C base pair and proton transfer from G to C can occur from step wise or concerted PCET within the DNA duplex.
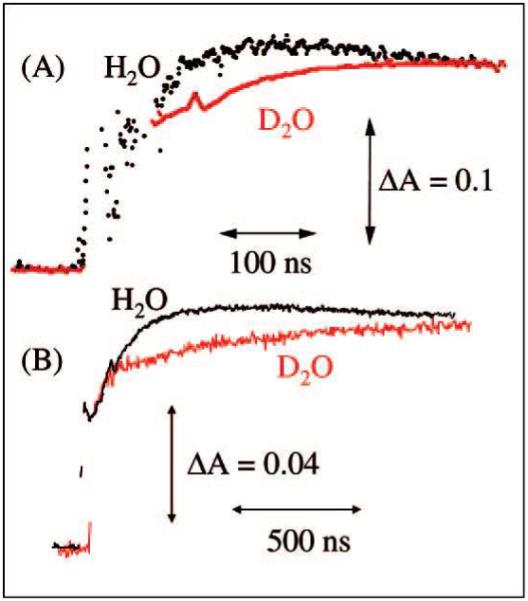
Absorbance changes at 625 nm after pulse radiolysis of dG (5.6 mM) (A) and double-stranded DNA (5′-AAAAAGGGAAAAA-3′) (2.1 mM) (B) in the presence of ammonium persulfate (20 mM), NaCl (0.1 M), and tert-butyl alcohol (0.1 M) in 20 mM sodium phosphate in H2O at pH 7 (black) or in D2O at pD 7 (red). (Figure reproduced with permission from ref. . Copyright 2008 American Chemical Society.)
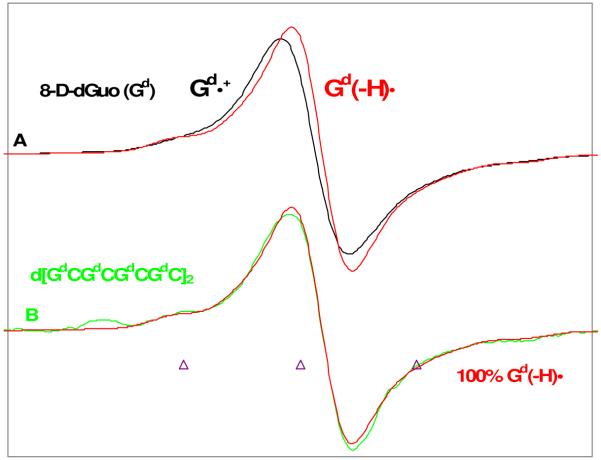
ESR spectra of (A) Gd•+ (black) and Gd(−H)• (red) obtained from glassy (7.5 M LiCl in D2O) samples of Gd [Gd = 8-D-dGuo, 96% D] (3 mg/mL). (B) Spectrum of the one-electron oxidized ds DNA oligomer d[GdCGdCGdCGdC]2 (2 mg/mL) with Gd(−H)• from A in red superimposed. The match of green and red spectra in (B) clearly shows that one-electron oxidized guanine in ds DNA oligomer exists as Gd(−H)•. One-electron oxidation of the monomer and the DNA-oligomers were carried out via thermal annealing at 155 K. All spectra were recorded at 77 K. (Modified Figure from Figure 2 of ref. . Copyright 2009 American Chemical Society.)
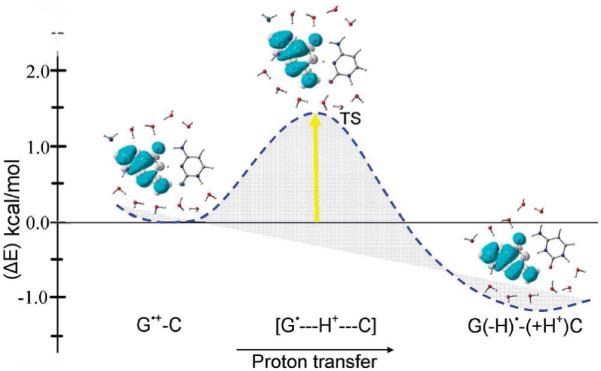
The B3LYP/6-31+G** calculated potential energy surface (PES) of proton transfer (PT) in G•+-C in the presence of 11 waters with zero point energy (ZPE) correction. Energy is given in kcal/mol. Spin density distributions during proton transfer are also shown. (Figure reproduced with permission from ref. . Copyright 2009 American Chemical Society.)
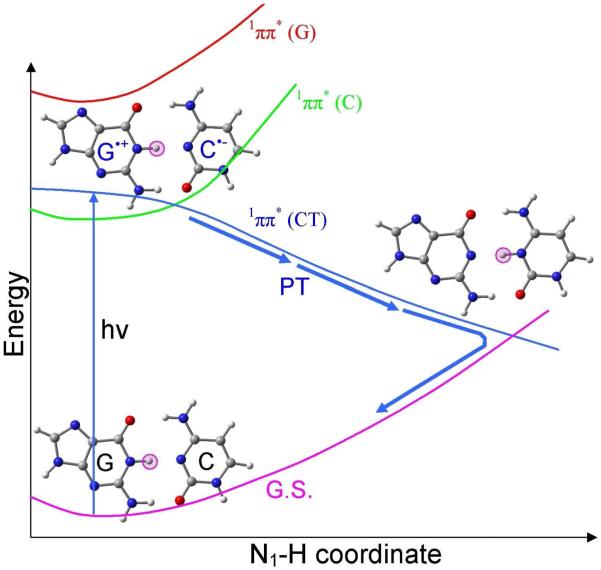
Sketch of the ultrafast excited state deactivation pathway of G-C base pair through proton coupled electron transfer mechanism.,
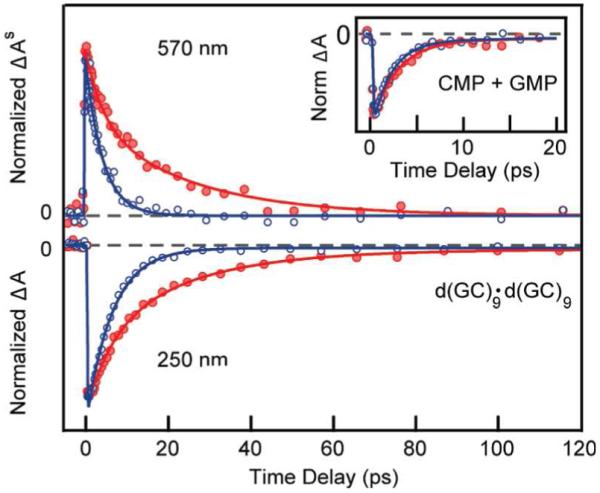
Normalized transient absorption signals showing (top) excited-state absorption and (bottom) ground-state bleach recovery of d(GC)9·d(GC)9 in H2O (blue) and D2O (red). The inset shows the 250 nm transient for an equimolar mixture of the monomers CMP and GMP in H2O (blue) and D2O (red). (Figure reproduced with permission from ref. . Copyright 2009 American Chemical Society.)
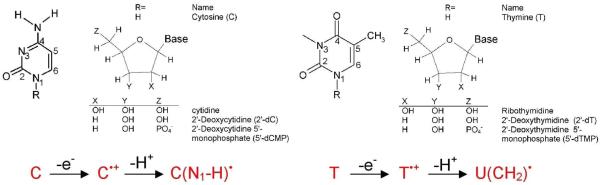
Typical deprotonation reactions of one electron oxidized cytosine and thymine.
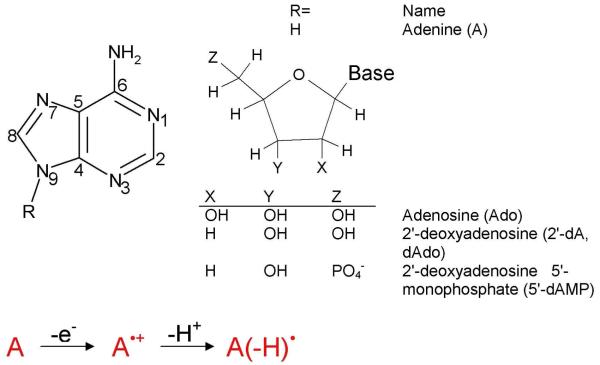
Deprotonation of one electron oxidized adenine.
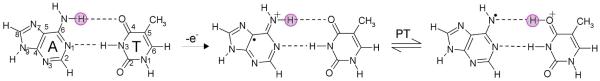
Scheme showing prototropic equilibria of proton transfer in one electron oxidized A-T base pair.
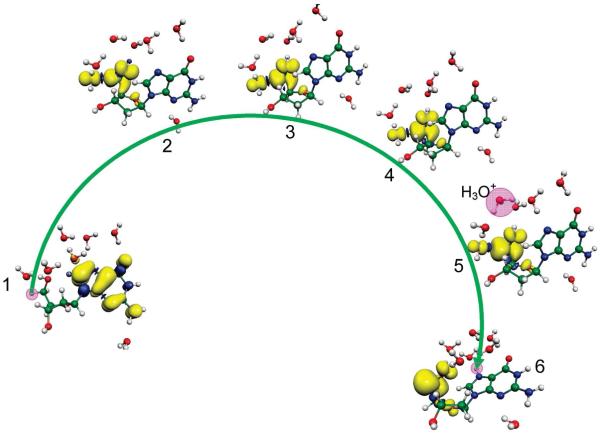
BHandHLYP/6-31G*//B3LYP/6-31G* calculated spin density distribution during proton transfer from C5′ on the deoxyribose group to the N7 site on guanine in dG•+ + 7H2O (step No. 1). The stretching of the C5′-H bond from its equilibrium bond length (1.099) to 1.23 Å (TS) (Step Nos. 1 and 2) results in the complete transfer of the hole from guanine to the C5′ site which is equivalent to electron transfer from the C5′ site to guanine. The pink circle highlights the transferring proton when not obscured by the spin distribution. (Figure reproduced with permission from ref. . Copyright 2009 American Chemical Society.)
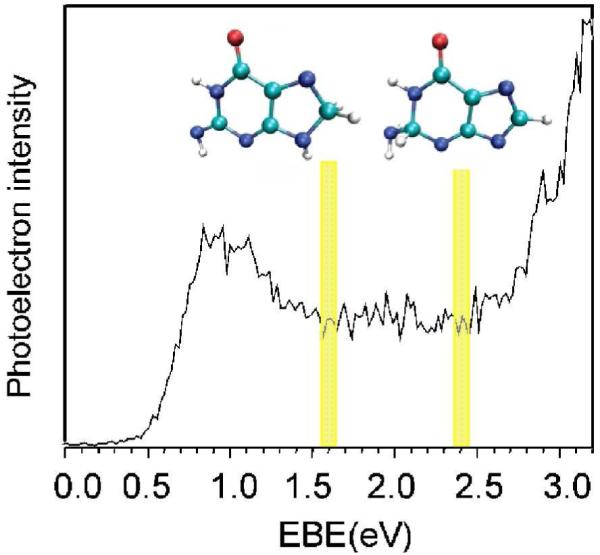
Photoelectron spectrum of G•− measured with 3.493 eV photons. The electron induced proton transferred structures (tautomers of G•−) present at 1.6 and 2.4 eV are shown. At 1.6 eV, proton transfers from NH2 group to C8 and at 2.4 eV proton transfers from N9 to C2 of guanine. For numbering, see Figure 11. (Figure 1 of ref. reproduced with permission. Copyright 2007 American Chemical Society. Structural figures taken from Figure 2 of ref. 237).
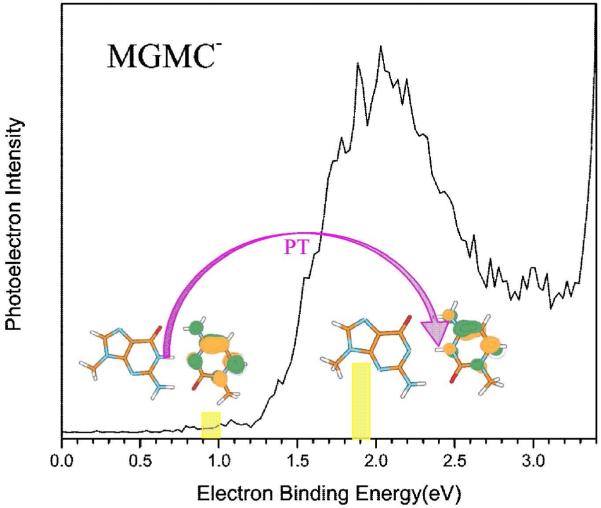
Photoelectron spectrum of the 9-methylguanine-1-methylcytosine radical anion (MGMC•−) recorded with 3.49 eV photons. Left structure is MGMC•− in Watson-Crick conformation. Right structure is due to proton transfer from N1 guanine to N3 site of cytosine. (Figure 3 of ref. reproduced with permission. Copyright 2009 American Chemical Society. Structural Figures taken from Figure 5 of ref. 242).
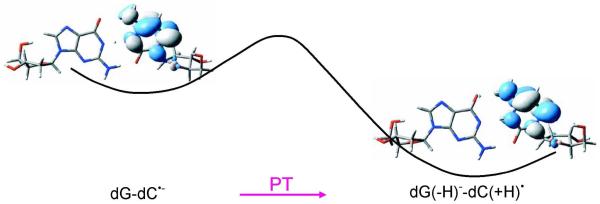
Plots of the singly occupied molecular orbitals (SOMOs) for the nucleoside pair dG-dC•− and proton transferred dG(−H)−-dC(+H)•. The dG(−H)−-dC(+H)• is 2.3 kcal/mol more stable than the dG-dC•− calculated by B3LYP/DZP++ method. (Figure 1 (in part) and Figure 4 (SOMO plots) reproduced with permission from ref. . Copyright 2007, American Institute of Physics).
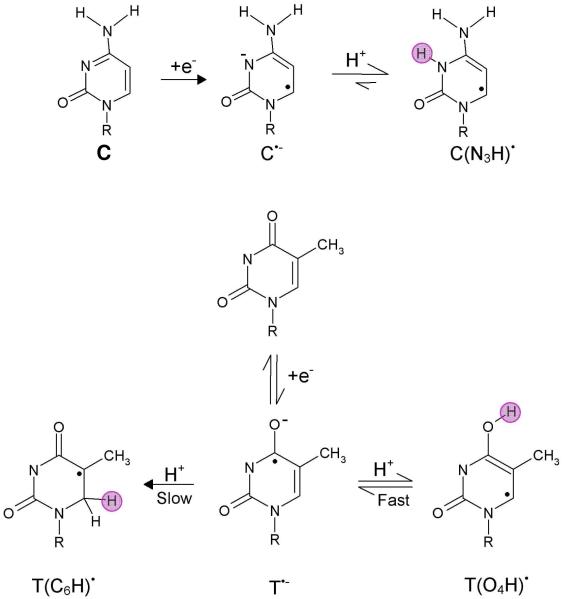
Neutral radical formation from one electron reduced cytosine and thymine bases (R=H, deoxyribose (phosphate)). The water acts as a proton (H+) donor. The site of protonation is shown by pink circle.
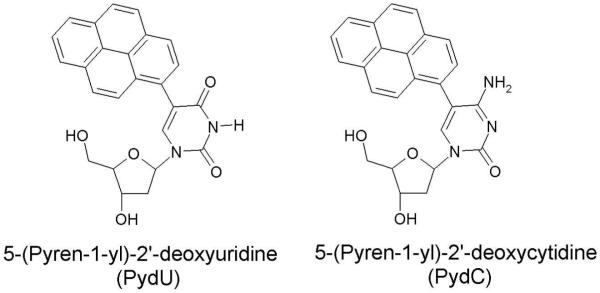
Structures of 5-(Pyren-1-yl)-2′-deoxyuridine (PydU) and 5-(Pyren-1-yl)-2′-deoxycytidine (PydC).
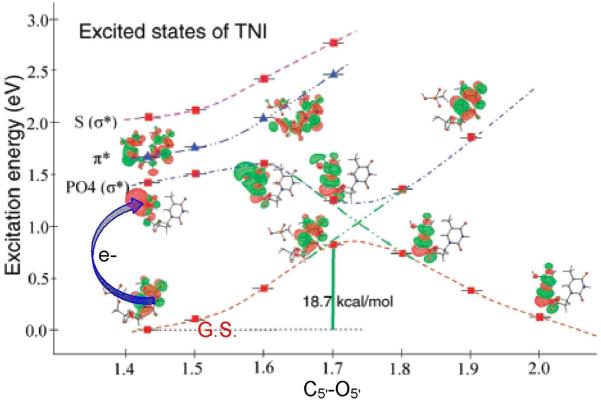
Lower curve: Potential energy surface (PES) of the 5′-dTMPH transient negative ion (TNI); calculated in the neutral optimized geometry of 5′-dTMPH with C5′-O5′ bond elongation. SOMO is shown at selected points. Upper curves: calculated vertical excitation energies of the radical anion at each point along the PES, MOs involved in excitations are also shown. Energies and distances are given in eV and Å, respectively. The lowest ππ*state (triangles) and lowest πσ* states (square) are shown. (Figure reproduced with permission from ref. . Copyright 2008 American Chemical Society.)
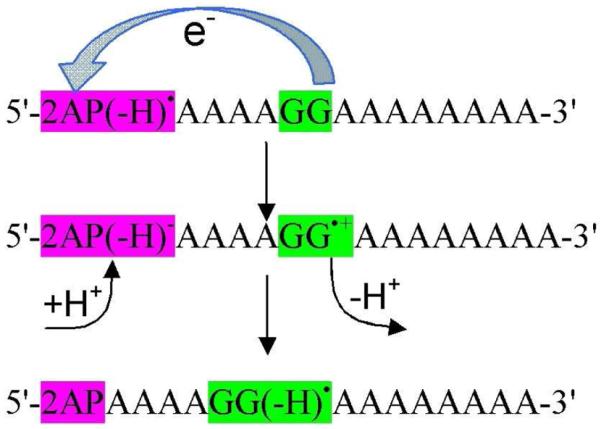
Oxidation of guanine by 2AP(−H)• subsequently proceeds through protonation and deprotonation from solvent and result in G(−H) • formation through PCET.
One electron oxidation of cytosine via PCET. See Ref. .
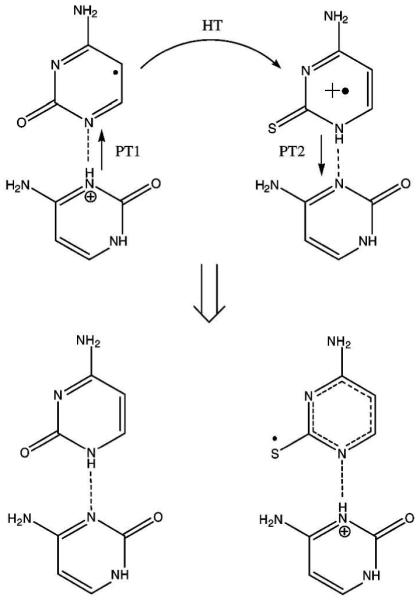
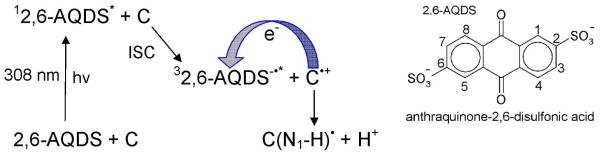
Formation of the thiocytosine deprotonated cation by PCHT. (Figure reproduced with permission from ref. . Copyright 2008 American Chemical Society.)
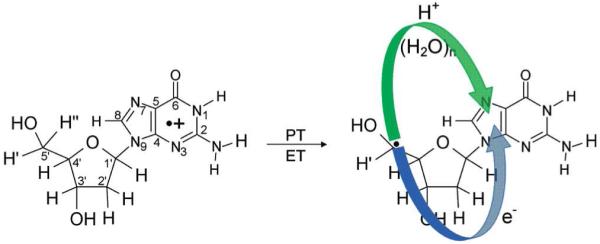
Formation of the Neutral Sugar Radical (C5′•) through a Proton Coupled Electron Transfer Mechanism in 2′-Deoxyguanosine radical cation (dG•+).a aThe proton transfers from C5′ to N7 of guanine through waters and results in electron transfer from C5′ to guanine yielding the product, (dG(•C5′, N7-H+) + 7H2O). (Figure reproduced with permission from ref. . Copyright 2009 American Chemical Society.)
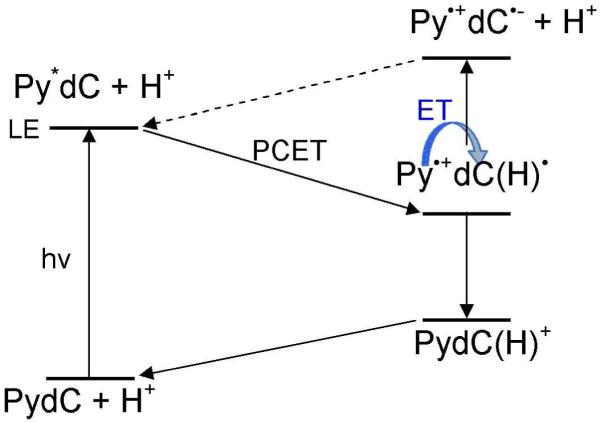
PCET process in excited state of PydC. Scheme redrawn from scheme 2 of ref. .
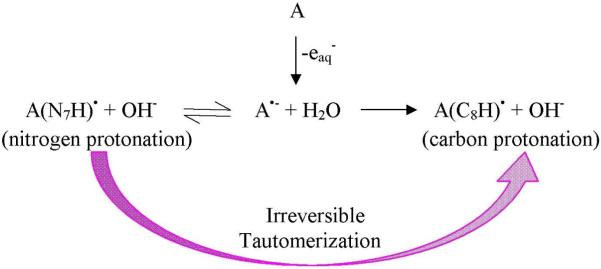
Hydrated electron (eaq−) induced protonation of the adenine base (A) in adenosine at nitrogen and carbon sites.
References
-
- Russell P. iGenetics. Benjamin Cummings; New York: 2001.
-
- Saenger W. Principles of Nucleic Acid Structure. Springer-Verlag; New York: 1984.
-
- von Sonntag C. The chemical basis of radiation biology. Taylor and Francis; London, New York, Philadelphia: 1987.
-
- Swiderek P. Angew. Chem. Int. Ed. 2006;45:4056. and references therein. - PubMed
-
- Turecek F. Adv. Quantum. Chem. 2007;52:89.
Publication types
MeSH terms
Substances
Grants and funding
LinkOut - more resources
Full Text Sources
