Comparative Study
. 2010 Sep;33(9):1486-501.
doi: 10.1111/j.1365-3040.2010.02158.x. Epub 2010 Apr 22.

Distinct signalling pathways and transcriptome response signatures differentiate ammonium- and nitrate-supplied plants

Affiliations
Comparative Study

Distinct signalling pathways and transcriptome response signatures differentiate ammonium- and nitrate-supplied plants

Kurt Patterson et al. Plant Cell Environ. 2010 Sep.

Abstract

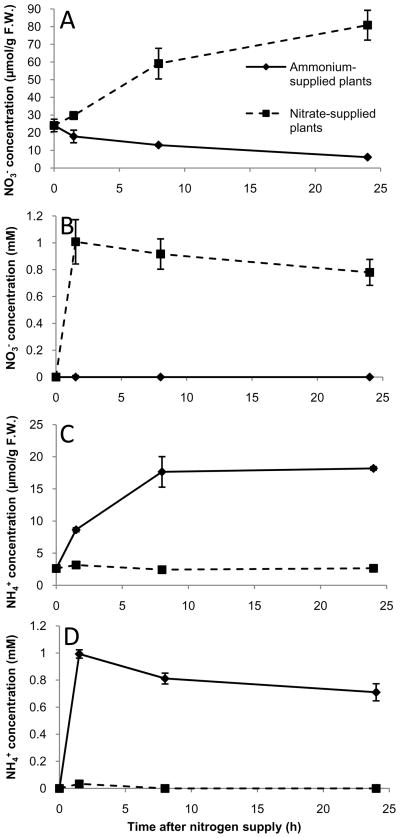
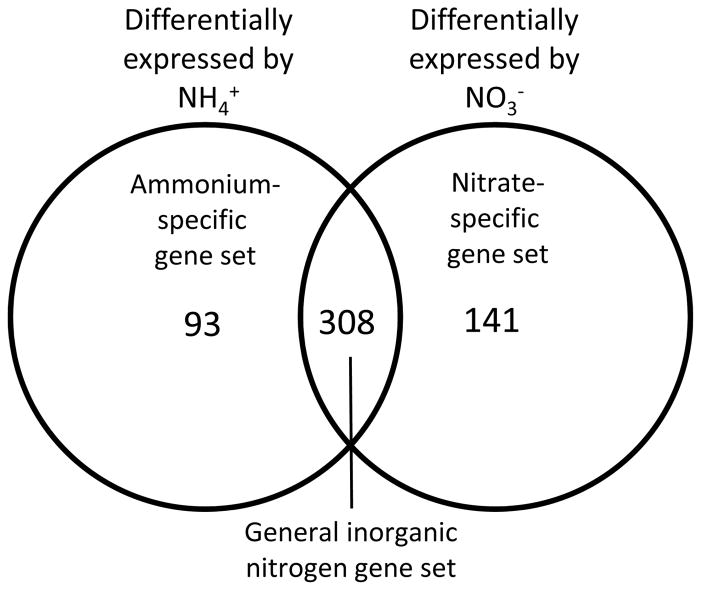
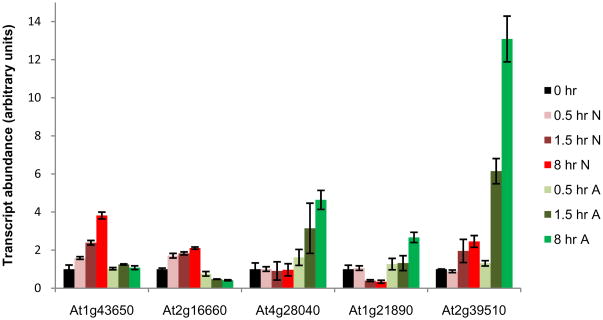
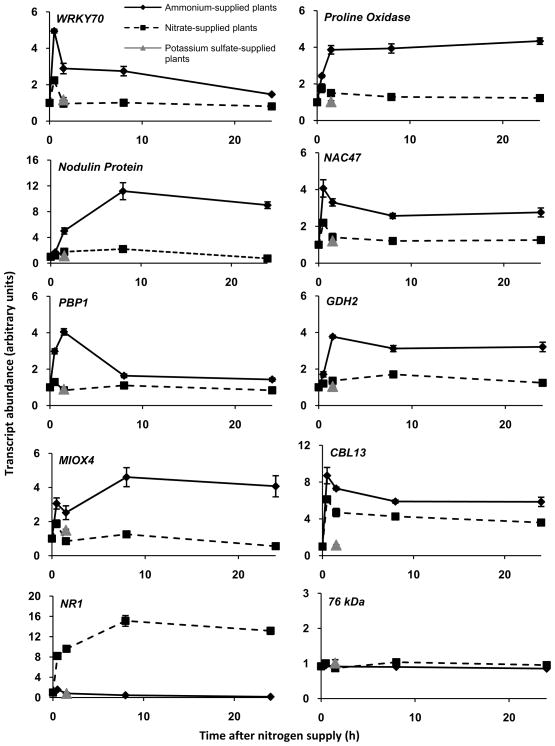
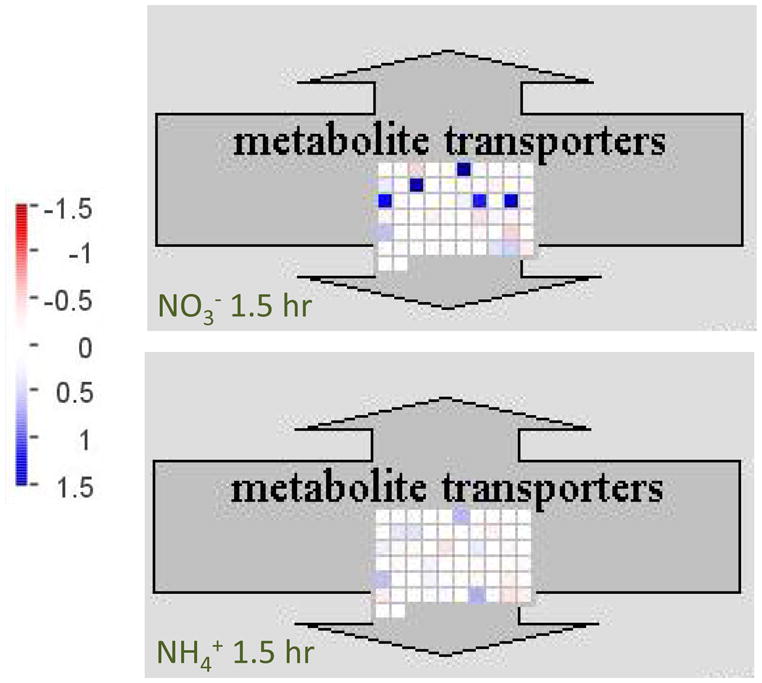
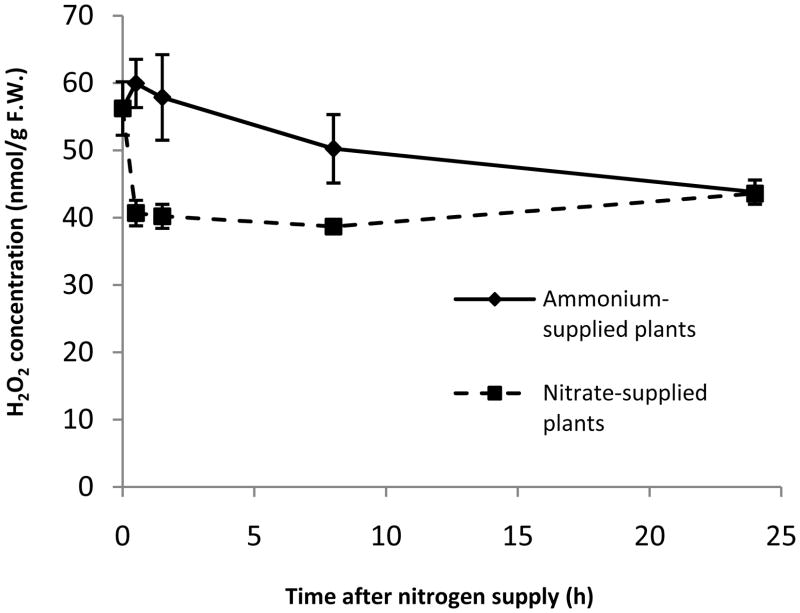
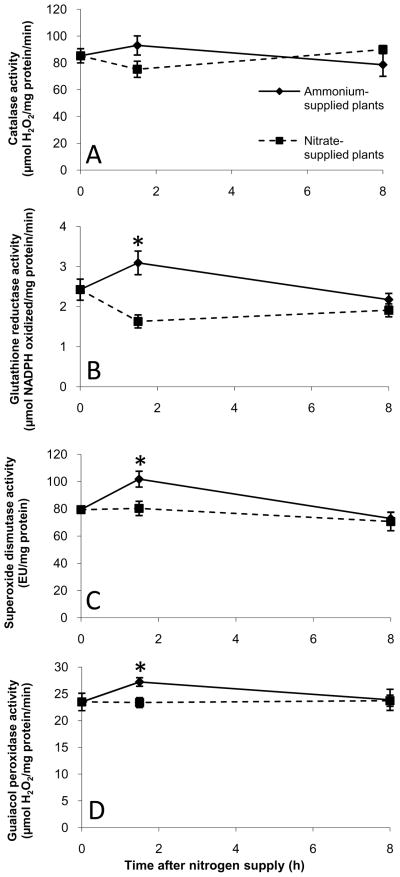
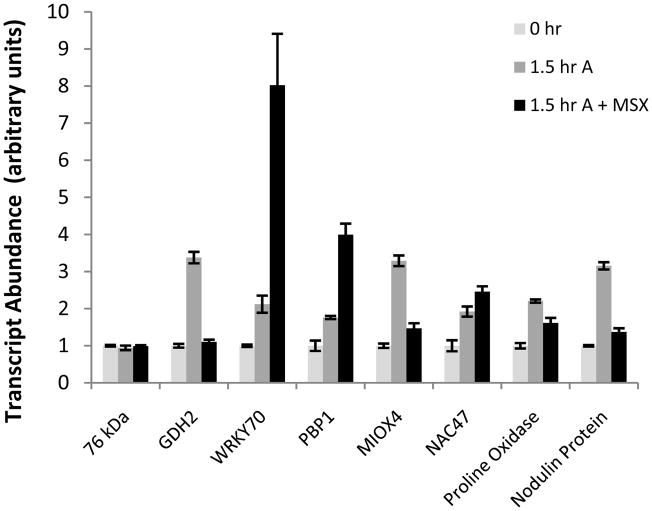
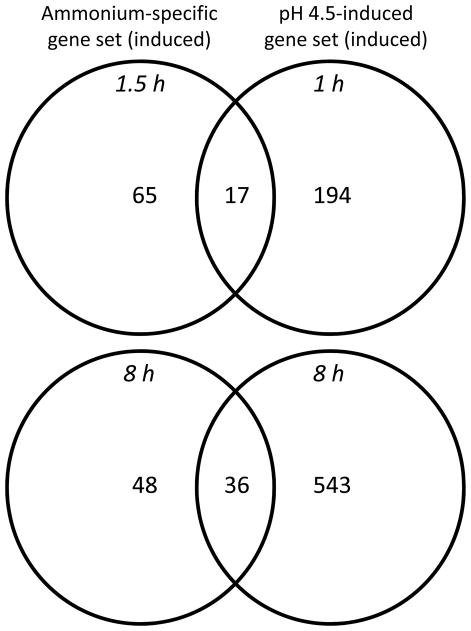
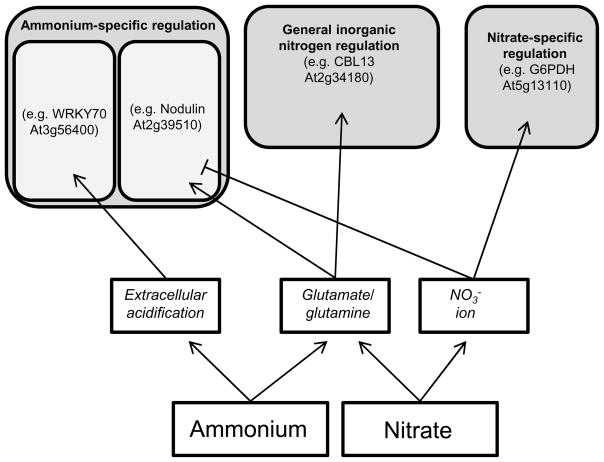
Nitrogen is the only macronutrient that is commonly available to plants in both oxidized and reduced forms, mainly nitrate and ammonium. The physiological and molecular effects of nitrate supply have been well studied, but comparatively little is known about ammonium nutrition and its differential effects on cell function and gene expression. We have used a physiologically realistic hydroponic growth system to compare the transcriptomes and redox status of the roots of ammonium- and nitrate-supplied Arabidopsis thaliana plants. While approximately 60% of nitrogen-regulated genes displayed common responses to both ammonium and nitrate, significant 'nitrate-specific' and 'ammonium-specific' gene sets were identified. Pathways involved in cytokinin response and reductant generation/distribution were specifically altered by nitrate, while a complex biotic stress response and changes in nodulin gene expression were characteristic of ammonium-supplied plants. Nitrate supply was associated with a rapid decrease in H(2)O(2) production, potentially because of an increased export of reductant from the mitochondrial matrix. The underlying basis of the nitrate- and ammonium-specific patterns of gene expression appears to be different signals elaborated from each nitrogen source, including alterations in extracellular pH that are associated with ammonium uptake, downstream metabolites in the ammonium assimilation pathway, and the presence or absence of the nitrate ion.


Figures

Figure 1
Figure 1
Nitrate and ammonium levels in root tissue (A, C) and nutrient medium (B, D) of hydroponically grown Arabidopsis thaliana plants. The nitrogen-depleted plants were supplied with 1 mM nitrate or 1 mM ammonium just after time (h) 0. Data are presented as means ± SEM from three separate tissue/medium samples for each treatment and time point.
Figure 2
Figure 2
Identification of Arabidopsis genes responsive to nitrate only, ammonium only, or both nitrogen forms at 1.5 h post nitrogen supply. In order to clearly differentiate nitrate-regulated genes from ammonium-regulated genes, the nitrate-specific set contains only those genes which display both ≥ 2-fold change in transcript abundance (compared to 0 h) in the nitrate treatment and ≤ 1.4-fold change in the ammonium treatment. Likewise, the ammonium-specific set contains genes displaying both ≥ 2-fold change in transcript abundance in the ammonium treatment and ≤ 1.4-fold change in the nitrate treatment. The general inorganic nitrogen set contains genes displaying ≥ 2-fold change in transcript abundance in either the ammonium or nitrate treatment and ≥ 1.4-fold change in the alternative nitrogen source. For all comparisons, adjusted P-values are ≤ 0.05. Corresponding ammonium-specific: general inorganic nitrogen: nitrate specific gene ratios at times 0.5 h and 8 h are 49:177:85 and 104:445:225, respectively.
Figure 3
Figure 3
Differential regulation of nodulin genes by nitrate and ammonium. Each bar represents the mean relative transcript abundance (± SD) of the corresponding gene, as determined by microarray analysis. For the 0, 1.5, and 8 h time points n = 3, and for the 0.5 h time point n = 2. Note that transcript abundance at time 0 h was arbitrarily assigned a value of 1, independently for each gene. Thus, comparisons of transcript abundance between different genes are not possible in this representation. N = nitrate, A = ammonium.
Figure 4
Figure 4
Timecourse analysis of genes differentially regulated by nitrate and ammonium using real time PCR. Nitrogen-limited plants were supplied with either ammonium (as [NH4]2SO4), nitrate (as KNO3), or potassium sulfate for the time periods indicated. Data are presented as means ± SEM from three independent experimental replicates. Transcript abundance at time 0 h was arbitrarily assigned a value of 1, independently for each gene. Note that potassium sulfate treatment was examined only at 1.5 h.
Figure 5
Figure 5
Analysis of mitochondrial carrier protein regulation using MapMan software (Usadel et al., 2005). Note that the values on the scale at left are log2 transformed.
Figure 6
Figure 6
H2O2 levels in Arabidopsis roots under ammonium and nitrate nutrition. Nitrogen limited plants were supplied with either ammonium or nitrate for the time periods indicated. Data from two separate experiments were combined to generate the figure. All data points represent means ± SEM (n = 6, except at 0.5 h where n = 3).
Figure 7
Figure 7
Activities of ROS-metabolizing enzymes in ammonium-supplied and nitrate-supplied Arabidopsis roots. Nitrogen-limited plants were supplied with either ammonium or nitrate for the time periods indicated. Catalase (A), glutathione reductase (B), superoxide dismutase (C), and guaiacol peroxidase (D) were measured in enzyme extracts as described in Materials and Methods. Data are presented as means ± SEM from at least three independent experimental replicates. Stars indicate statistically significant differences (P < 0.05) in enzyme activity between nitrate-supplied and ammonium-supplied plants. For the superoxide dismutase assay, one enzyme unit is defined as the quantity of superoxide dismutase required to produce a 50% inhibition of nitro blue tetrazolium photoreduction (Dhindsa et al., 1981).
Figure 8
Figure 8
The effects of the glutamine synthetase inhibitor MSX on the expression of ammonium-induced genes. Nitrogen-limited plants were supplied with either 1 mM ammonium (1.5 h A) or 1 mM ammonium + 1 mM MSX (1.5 h A + MSX) for 1.5 h. Data are presented as means ± SEM from three independent experimental replicates. Transcript abundance at time 0 h was arbitrarily assigned a value of 1, independently for each gene.
Figure 9
Figure 9
A common group of genes is regulated by ammonium and acidic extracellular pH in Arabidopsis roots. The ammonium-specific gene sets contain genes that display ≥ 2-fold increases in transcript abundance (compared to time 0 h) in the ammonium treatment and ≤ 1.4 fold increase in the nitrate treatment (see Fig. 2). The pH 4.5-induced gene sets contain genes displaying ≥ 2-fold increase in transcript abundance (compared to pH 6.0). For all comparisons, adjusted P-values are ≤ 0.05.
Figure 10
Figure 10
A model of inorganic nitrogen signaling in Arabidopsis roots. Signals derived from ammonium and nitrate nutrition are italicized.

Similar articles

Cited by

References

    1. Beers RF, Sizer IW. A spectrophotometric method for measuring the breakdown of hydrogen peroxide by catalase. Journal of Biological Chemistry. 1952;195:133–140. - PubMed
    1. Benjamini Y, Hochberg Y. Controlling the false discovery rate - a practical and powerful approach to multiple testing. Journal of the Royal Statistical Society. Series B. 1995;57:289–300.
    1. Bi YM, Wang RL, Zhu T, Rothstein SJ. Global transcription profiling reveals differential responses to chronic nitrogen stress and putative nitrogen regulatory components in Arabidopsis. BMC Genomics. 2007;8:1–17. - PMC - PubMed
    1. Bi YM, Kant S, Clark J, Gidda S, Ming F, Xu J, Rochon A, Shelp BJ, Hao L, Zhao R, Mullen RT, Zhu T, Rothstein SJ. Increased nitrogen use efficiency in transgenic rice plants over-expressing a nitrogen-responsive early nodulin gene identified from rice expression profiling. Plant, Cell and Environment. 2009;32:1749–1760. - PubMed
    1. Bloom AJ. Nitrogen as a limiting factor: Crop acquisition of ammonium and nitrate. In: Jackson LE, editor. Ecology in Agriculture. Academic Press; San Diego, USA: 1997. pp. 145–172.

Publication types