

Learning gene regulatory networks from only positive and unlabeled data
- PMID: 20444264
- PMCID: PMC2887423
- DOI: 10.1186/1471-2105-11-228
Learning gene regulatory networks from only positive and unlabeled data
Abstract
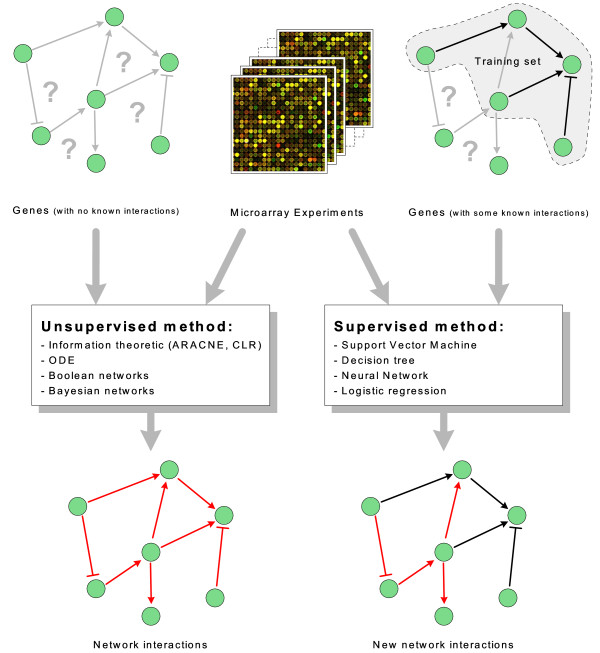
Background: Recently, supervised learning methods have been exploited to reconstruct gene regulatory networks from gene expression data. The reconstruction of a network is modeled as a binary classification problem for each pair of genes. A statistical classifier is trained to recognize the relationships between the activation profiles of gene pairs. This approach has been proven to outperform previous unsupervised methods. However, the supervised approach raises open questions. In particular, although known regulatory connections can safely be assumed to be positive training examples, obtaining negative examples is not straightforward, because definite knowledge is typically not available that a given pair of genes do not interact.
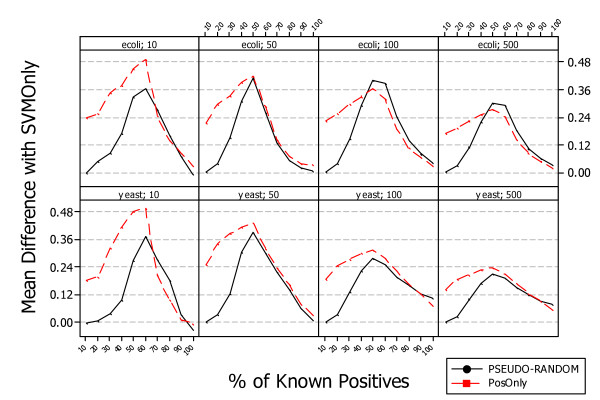
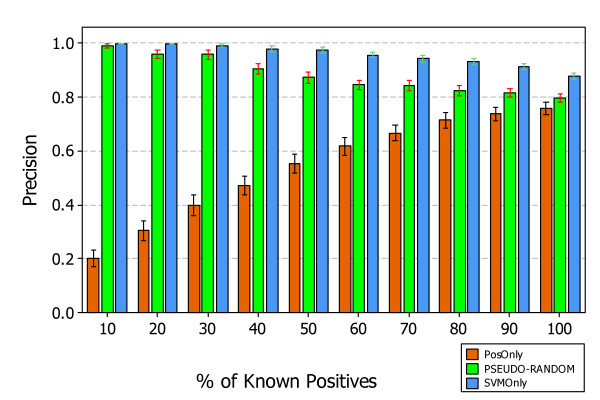
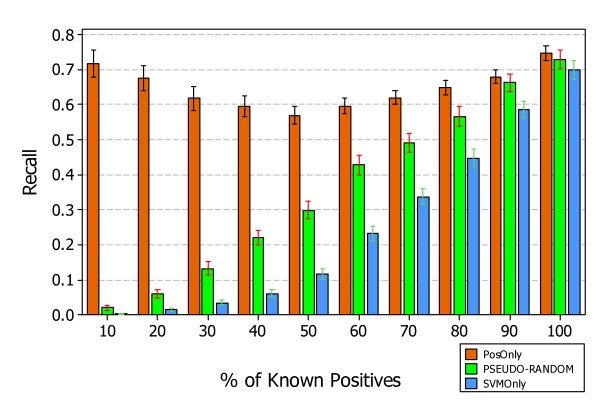
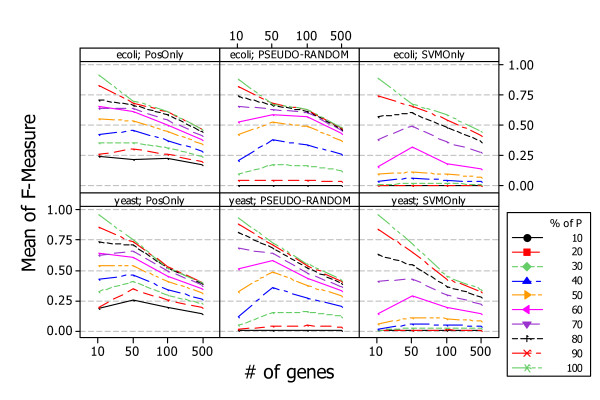
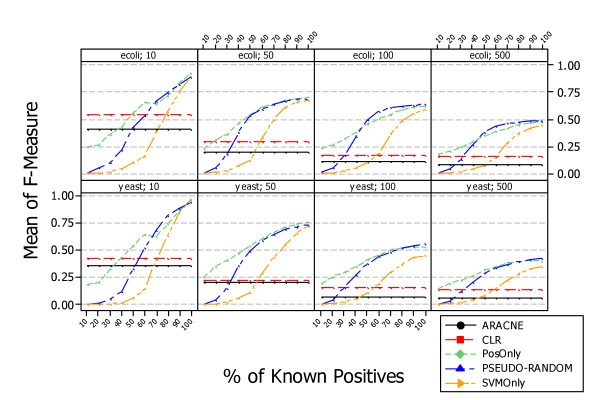
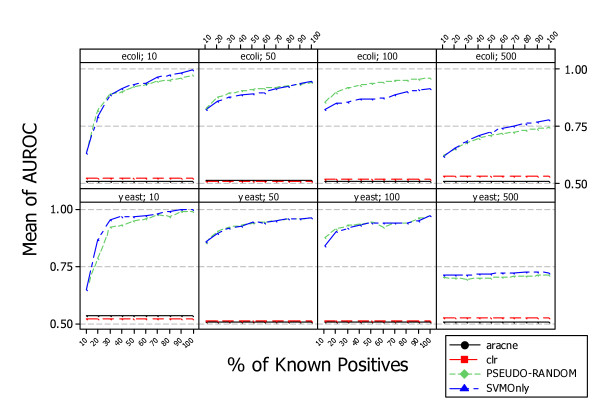
Results: A recent advance in research on data mining is a method capable of learning a classifier from only positive and unlabeled examples, that does not need labeled negative examples. Applied to the reconstruction of gene regulatory networks, we show that this method significantly outperforms the current state of the art of machine learning methods. We assess the new method using both simulated and experimental data, and obtain major performance improvement.
Conclusions: Compared to unsupervised methods for gene network inference, supervised methods are potentially more accurate, but for training they need a complete set of known regulatory connections. A supervised method that can be trained using only positive and unlabeled data, as presented in this paper, is especially beneficial for the task of inferring gene regulatory networks, because only an incomplete set of known regulatory connections is available in public databases such as RegulonDB, TRRD, KEGG, Transfac, and IPA.
Figures


Similar articles
-
A negative selection heuristic to predict new transcriptional targets.BMC Bioinformatics. 2013;14 Suppl 1(Suppl 1):S3. doi: 10.1186/1471-2105-14-S1-S3. Epub 2013 Jan 14. BMC Bioinformatics. 2013. PMID: 23368951 Free PMC article.
-
Multi-task learning for the simultaneous reconstruction of the human and mouse gene regulatory networks.Sci Rep. 2020 Dec 18;10(1):22295. doi: 10.1038/s41598-020-78033-7. Sci Rep. 2020. PMID: 33339842 Free PMC article.
-
Supervised inference of gene regulatory networks from positive and unlabeled examples.Methods Mol Biol. 2013;939:47-58. doi: 10.1007/978-1-62703-107-3_5. Methods Mol Biol. 2013. PMID: 23192540
-
Effects of functional bias on supervised learning of a gene network model.Methods Mol Biol. 2009;541:463-75. doi: 10.1007/978-1-59745-243-4_20. Methods Mol Biol. 2009. PMID: 19381535 Review.
-
Overview and Evaluation of Recent Methods for Statistical Inference of Gene Regulatory Networks from Time Series Data.Methods Mol Biol. 2019;1883:49-94. doi: 10.1007/978-1-4939-8882-2_3. Methods Mol Biol. 2019. PMID: 30547396 Review.
Cited by
-
Gene network landscape of the ciliate Tetrahymena thermophila.PLoS One. 2011;6(5):e20124. doi: 10.1371/journal.pone.0020124. Epub 2011 May 26. PLoS One. 2011. PMID: 21637855 Free PMC article.
-
A negative selection heuristic to predict new transcriptional targets.BMC Bioinformatics. 2013;14 Suppl 1(Suppl 1):S3. doi: 10.1186/1471-2105-14-S1-S3. Epub 2013 Jan 14. BMC Bioinformatics. 2013. PMID: 23368951 Free PMC article.
-
Identification of a novel gene signature of ES cells self-renewal fluctuation through system-wide analysis.PLoS One. 2014 Jan 2;9(1):e83235. doi: 10.1371/journal.pone.0083235. eCollection 2014. PLoS One. 2014. PMID: 24392082 Free PMC article.
-
Inference of time-delayed gene regulatory networks based on dynamic Bayesian network hybrid learning method.Oncotarget. 2017 Sep 23;8(46):80373-80392. doi: 10.18632/oncotarget.21268. eCollection 2017 Oct 6. Oncotarget. 2017. PMID: 29113310 Free PMC article.
-
Single_cell_GRN: gene regulatory network identification based on supervised learning method and Single-cell RNA-seq data.BioData Min. 2022 Jun 11;15(1):13. doi: 10.1186/s13040-022-00297-8. BioData Min. 2022. PMID: 35690842 Free PMC article.
References
-
- Hecker M, Lambeck S, Toepfer S, van Someren E, Guthke R. Gene regulatory network inference: Data integration in dynamic models-A review. Bio Systems. 2008;96(1):86–103. - PubMed
-
- Faith JJ, Hayete B, Thaden JT, Mogno I, Wierzbowski J, Cottarel G, Kasif S, Collins JJ, Gardner TS. Large-Scale Mapping and Validation of Escherichia coli Transcriptional Regulation from a Compendium of Expression Profiles. PLoS Biol. 2007;5:e8. doi: 10.1371/journal.pbio.0050008. - DOI - PMC - PubMed
-
- Liang S, Fuhrman S, Somogyi R. Reveal, a general reverse engineering algorithm for inference of genetic network architectures. Pac Symp Biocomput. 1998. pp. 18–29. - PubMed
