. 2010 May 5:3:15.
doi: 10.1186/1755-8794-3-15.

Peripheral blood gene expression patterns discriminate among chronic inflammatory diseases and healthy controls and identify novel targets

Affiliations

Peripheral blood gene expression patterns discriminate among chronic inflammatory diseases and healthy controls and identify novel targets

Bertalan Mesko et al. BMC Med Genomics. .

Abstract

Background: Chronic inflammatory diseases including inflammatory bowel disease (IBD; Crohn's disease and ulcerative colitis), psoriasis and rheumatoid arthritis (RA) afflict millions of people worldwide, but their pathogenesis is still not well understood. It is also not well known if distinct changes in gene expression characterize these diseases and if these patterns can discriminate between diseased and control patients and/or stratify the disease. The main focus of our work was the identification of novel markers that overlap among the 3 diseases or discriminate them from each other.

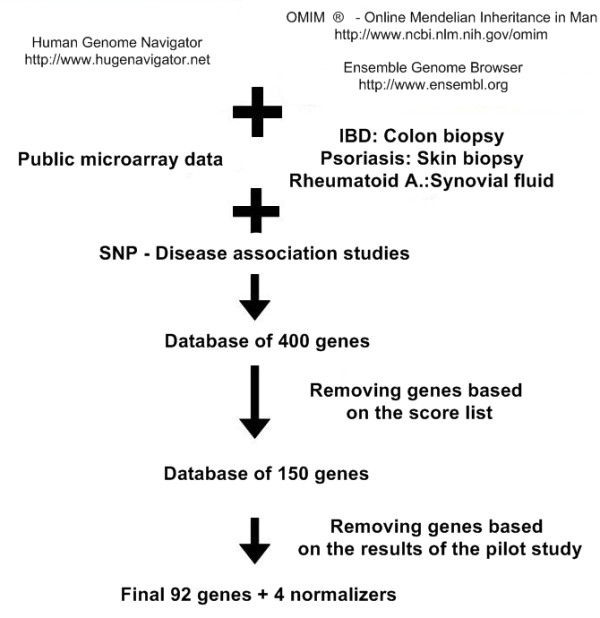
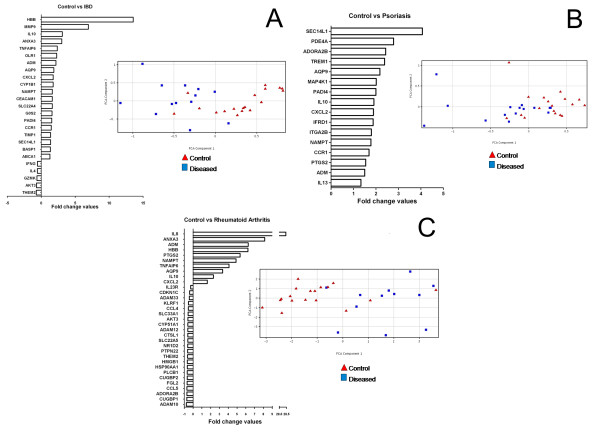
Methods: Diseased (n = 13, n = 15 and n = 12 in IBD, psoriasis and RA respectively) and healthy patients (n = 18) were recruited based on strict inclusion and exclusion criteria; peripheral blood samples were collected by clinicians (30 ml) in Venous Blood Vacuum Collection Tubes containing EDTA and peripheral blood mononuclear cells were separated by Ficoll gradient centrifugation. RNA was extracted using Trizol reagent. Gene expression data was obtained using TaqMan Low Density Array (TLDA) containing 96 genes that were selected by an algorithm and the statistical analyses were performed in Prism by using non-parametric Mann-Whitney U test (P-values < 0.05).

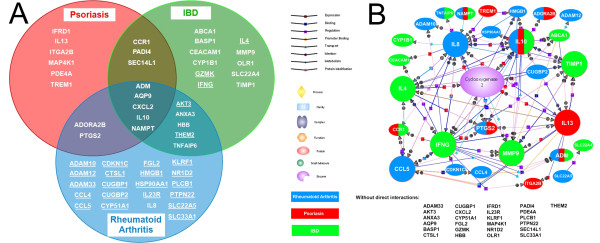
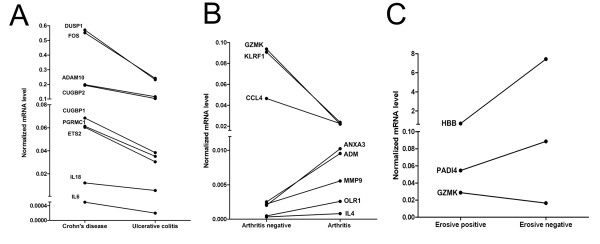
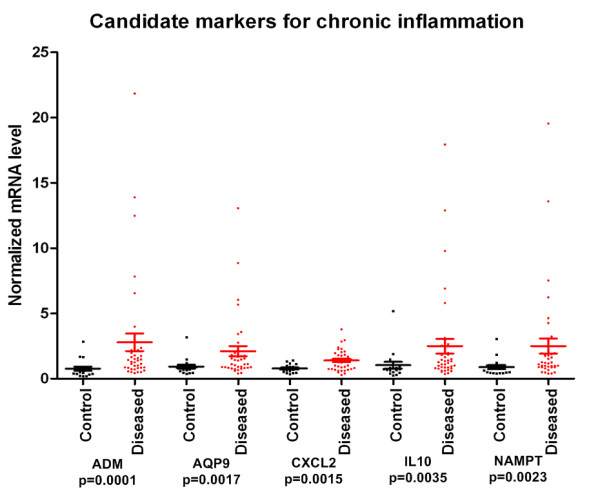
Results: Here we show that using a panel of 96 disease associated genes and measuring mRNA expression levels in peripheral blood derived mononuclear cells; we could identify disease-specific gene panels that separate each disease from healthy controls. In addition, a panel of five genes such as ADM, AQP9, CXCL2, IL10 and NAMPT discriminates between all samples from patients with chronic inflammation and healthy controls. We also found genes that stratify the diseases and separate different subtypes or different states of prognosis in each condition.

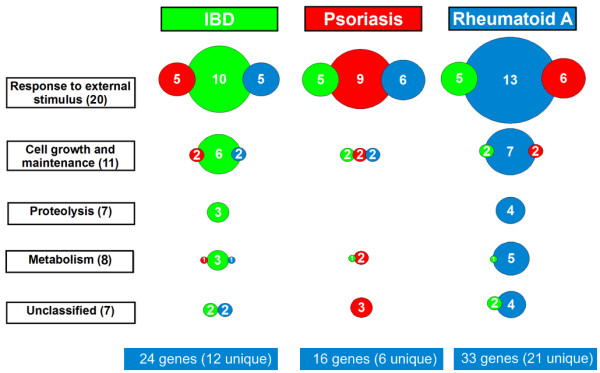
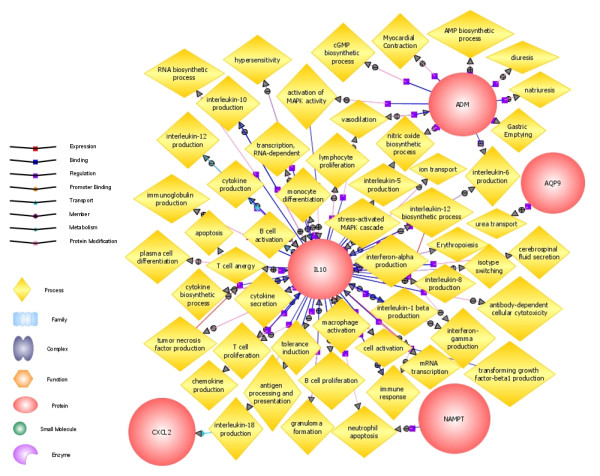
Conclusions: These findings and the identification of five universal markers of chronic inflammation suggest that these diseases have a common background in pathomechanism, but still can be separated by peripheral blood gene expression. Importantly, the identified genes can be associated with overlapping biological processes including changed inflammatory response. Gene panels based on such markers can play a major role in the development of personalized medicine, in monitoring disease progression and can lead to the identification of new potential drug targets in chronic inflammation.


Figures

Figure 1
Figure 1
Flowchart of gene selection process. A flow chart of the gene selection process shows the steps through which we chose the final 96 genes out of the database containing 400 genes.
Figure 2
Figure 2
Fold changes of genes differentiating between diseased and control samples. Fold change values of genes, showing statistically significant (Mann-Whitney U test) differential expression between diseased and control patients, were generated from RT-QPCR measurements and represent the difference of the means of the diseased and control groups. Principal component analysis was performed and separates the two groups of samples. 2a represents the IBD, 2b the psoriasis and 2c the RA gene panel.
Figure 3
Figure 3
Genes separating chronic inflammatory diseases from controls. (a) Venn diagram shows all of those genes that show significant differences between each disease group and control samples. Each set contains genes that separate control samples only from the particular disease or diseases. Underlined genes were down-regulated compared to healthy controls. (b) Gene interaction analysis in GeneSpring GX in Direct Interactions mode highlights 28 genes that have direct interactions with each other while 25 genes have no direct interactions. Genes with the highest number of interactions are shown in extended size. Cyclooxygenase 2 enzyme is located in the middle of this pathway network. The genes that showed significant differences between one of the diseased groups and healthy controls have color codes in which blue represents RA, green represents IBD and red codes for psoriasis-related genes.
Figure 4
Figure 4
Functional categorization of significantly changing genes. We found 53 genes that show significantly differences between chronic inflammatory diseases and control samples. These genes were grouped into functional categories made by EASE. Genes were grouped in the category that had the highest relevance according to the EASE software. Colors represent disease groups. The size of the diagrams correlates with the number of genes in each set. Overlapping sets of genes are shown as overlapping diagrams.
Figure 5
Figure 5
Correlation between gene expression levels and clinical parameters. Normalized mRNA levels of genes showing significant differences between patients with (a) Crohn's disease and Ulcerative colitis; (b) psoriasis patients with and without arthritis; (c) RA patients with and without MR-confirmed bone erosion were generated from RT-QPCR measurements and represent the means of the expression levels of the diseased and control groups.
Figure 6
Figure 6
Peripheral blood derived universal markers of chronic inflammation. Normalized mRNA levels of genes (with SD) showing significant differences between all the samples of chronic inflammatory diseases and healthy controls were generated from RT-QPCR measurements.
Figure 7
Figure 7
Pathway analysis of universal markers of chronic inflammation. Pathway analysis was carried out with GeneSpring GX Biological Processes mode that revealed all the biological processes the genes are related to. Circles represent the 5 genes; deltoids represent biological processes.

Similar articles

Cited by

References

    1. Silman AJ, Pearson JE. Epidemiology and genetics of rheumatoid arthritis. Arthritis Res. 2002;4(Suppl 3):S265–272. doi: 10.1186/ar578. - DOI - PMC - PubMed
    1. Langley RG, Krueger GG, Griffiths CE. Psoriasis: epidemiology, clinical features, and quality of life. Ann Rheum Dis. 2005;64(Suppl 2):ii18–23. doi: 10.1136/ard.2004.033217. discussion ii24-15. - DOI - PMC - PubMed
    1. Loftus EV Jr. Clinical epidemiology of inflammatory bowel disease: Incidence, prevalence, and environmental influences. Gastroenterology. 2004;126(6):1504–1517. doi: 10.1053/j.gastro.2004.01.063. - DOI - PubMed
    1. Wu F, Dassopoulos T, Cope L, Maitra A, Brant SR, Harris ML, Bayless TM, Parmigiani G, Chakravarti S. Genome-wide gene expression differences in Crohn's disease and ulcerative colitis from endoscopic pinch biopsies: insights into distinctive pathogenesis. Inflamm Bowel Dis. 2007;13(7):807–821. doi: 10.1002/ibd.20110. - DOI - PubMed
    1. Nomura I, Gao B, Boguniewicz M, Darst MA, Travers JB, Leung DY. Distinct patterns of gene expression in the skin lesions of atopic dermatitis and psoriasis: a gene microarray analysis. J Allergy Clin Immunol. 2003;112(6):1195–1202. doi: 10.1016/j.jaci.2003.08.049. - DOI - PubMed

Publication types