PKCalpha mediated induction of miR-101 in human hepatoma HepG2 cells
- PMID: 20444294
- PMCID: PMC2874775
- DOI: 10.1186/1423-0127-17-35
PKCalpha mediated induction of miR-101 in human hepatoma HepG2 cells
Abstract
Background: Protein Kinase C (PKC) is a serine/threonine kinase that involved in controlling of many cellular processes such as cell proliferation and differentiation. We have observed previously that TPA (12-O-tetradecanoylphorbol 13-acetate) induces cell cycle arrest in G0/G1 phase in human hepatoma HepG2 cells. However, is there any miRNA involved in PKCalpha mediated cell growth arrest is still unknown.
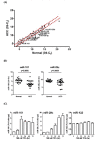
Methods: We first surveyed 270 miRNA expression profiles in 20 pairs of human hepatoma tissues. We identified 11 up-regulated and 23 down-regulated miRNAs (FDR < = 0.01; fold-change > = 2) in human hepatoma tissue after Student's T-test and Mann-Whitney rank test. We then examined miRNAs expression profile in TPA treated HepG2 cells. Two miRNAs, miR-101, and miR-29c, were shown to be significantly down regulated in human hepatoma tissues and induced over 4-fold in HepG2 cells under TPA treatment.
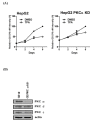
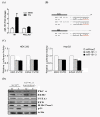
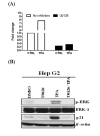
Results: In this study, we examined TPA regulated miRNA expression profile in human hepatoma HepG2 cells. We identified two miRNAs, 101 and 29c, were induced by TPA and down regulated in human hepatoma tissues suggest that they might play as tumor suppressor gene and in tumor formation of HCC. Since induction kinetics of miR-101 by TPA was much faster than miR-29c suggests that the induction of miR-101 may be the primary response of TPA treatment. We then further investigated how miR-101 was regulated by TPA. MiR-101 targets two subunits of PRC2 complex, enhancer of zeste homolog 2 (EZH2) and EED, and was shown to play as a tumor suppressor gene in human prostate, breast and liver cancers. The target sequence of miR-101 located in the 3' UTR of both EZH2 and EED's mRNA was identified by bioinformatic analysis and was validated by reporter luciferase activity assay. Then we showed that TPA not only up regulated miR-101 expression, but also reduced protein level of EZH2, EED and H3K27me3 in HepG2 cells. Using lenti-virus-mediated shRNA to knockdown endogenous PKCalpha expression, we observed that TPA induced growth arrest, elevation of miR-101 and reduction of EZH2, EED and H3K27me3 proteins were all PKCalpha dependent. Specific inhibitor of ERK completely blocked TPA induced miR-101 expression.
Conclusions: Therefore, this is the first time to show that PKCalpha and ERK pathway play important role to activate miR-101 expression, reduce PRC2 complex and H3K27me3 level. This epigenetic regulatory pathway may represent a novel mechanism of carcinogenesis and deserve further investigation.
Figures


Similar articles
-
Enhancer of zeste homolog 2 epigenetically silences multiple tumor suppressor microRNAs to promote liver cancer metastasis.Hepatology. 2012 Aug;56(2):622-31. doi: 10.1002/hep.25679. Epub 2012 Jun 11. Hepatology. 2012. PMID: 22370893
-
Protein kinase C alpha trigger Ras and Raf-independent MEK/ERK activation for TPA-induced growth inhibition of human hepatoma cell HepG2.Cancer Lett. 2006 Jul 28;239(1):27-35. doi: 10.1016/j.canlet.2005.07.034. Epub 2005 Sep 19. Cancer Lett. 2006. PMID: 16169661
-
MicroRNA-26a suppresses epithelial-mesenchymal transition in human hepatocellular carcinoma by repressing enhancer of zeste homolog 2.J Hematol Oncol. 2016 Jan 6;9:1. doi: 10.1186/s13045-015-0229-y. J Hematol Oncol. 2016. PMID: 26733151 Free PMC article.
-
Regulation of the MIR155 host gene in physiological and pathological processes.Gene. 2013 Dec 10;532(1):1-12. doi: 10.1016/j.gene.2012.12.009. Epub 2012 Dec 14. Gene. 2013. PMID: 23246696 Review.
-
Complex analysis of genes involved in the inflammatory response: interleukin-1-induced differential transcriptome of cultured human hepatoma HepG2 cells.Acta Biochim Pol. 2003;50(3):573-82. Acta Biochim Pol. 2003. PMID: 14515140 Review.
Cited by
-
Molecular therapies delaying cardiovascular aging: disease- or health-oriented approaches.Vasc Biol. 2020 Jan 16;2(1):R45-R58. doi: 10.1530/VB-19-0029. eCollection 2020. Vasc Biol. 2020. PMID: 32923974 Free PMC article. Review.
-
microRNA-101 is a potent inhibitor of autophagy.EMBO J. 2011 Sep 13;30(22):4628-41. doi: 10.1038/emboj.2011.331. EMBO J. 2011. PMID: 21915098 Free PMC article.
-
The expression and functions of microRNAs in pancreatic adenocarcinoma and hepatocellular carcinoma.Chin J Cancer. 2011 Aug;30(8):540-50. doi: 10.5732/cjc.011.10197. Chin J Cancer. 2011. PMID: 21801602 Free PMC article. Review.
-
Crosstalk between Noncoding RNAs and the Epigenetics Machinery in Pediatric Tumors and Their Microenvironment.Cancers (Basel). 2023 May 19;15(10):2833. doi: 10.3390/cancers15102833. Cancers (Basel). 2023. PMID: 37345170 Free PMC article. Review.
-
miR-101 reverses hypomethylation of the PRDM16 promoter to disrupt mitochondrial function in astrocytoma cells.Oncotarget. 2016 Jan 26;7(4):5007-22. doi: 10.18632/oncotarget.6652. Oncotarget. 2016. PMID: 26701852 Free PMC article.
References
-
- Volinia S, Calin GA, Liu CG, Ambs S, Cimmino A, Petrocca F, Visone R, Iorio M, Roldo C, Ferracin M, Prueitt RL, Yanaihara N, Lanza G, Scarpa A, Vecchione A, Negrini M, Harris CC, Croce CM. A microRNA expression signature of human solid tumors defines cancer gene targets. Proc Natl Acad Sci USA. 2006;103(7):2257–2261. doi: 10.1073/pnas.0510565103. - DOI - PMC - PubMed
-
- Calin GA, Liu CG, Sevignani C, Ferracin M, Felli N, Dumitru CD, Shimizu M, Cimmino A, Zupo S, Dono M, Dell'Aquila ML, Alder H, Rassenti L, Kipps TJ, Bullrich F, Negrini M, Croce CM. MicroRNA profiling reveals distinct signatures in B cell chronic lymphocytic leukemias. Proc Natl Acad Sci USA. 2004;101(32):11755–11760. doi: 10.1073/pnas.0404432101. - DOI - PMC - PubMed
Publication types
MeSH terms
Substances
LinkOut - more resources
Full Text Sources
Medical
Miscellaneous

