. 2010 Jul 16;285(29):22082-90.
doi: 10.1074/jbc.M110.117713. Epub 2010 May 5.

Dissecting the in vivo metabolic potential of two human gut acetogens

Affiliations

Dissecting the in vivo metabolic potential of two human gut acetogens

Federico E Rey et al. J Biol Chem. .

Abstract

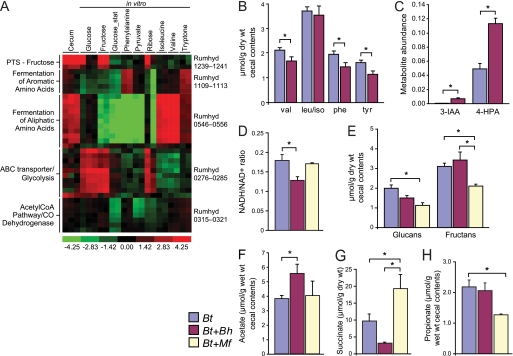
Fermenting microbial communities generate hydrogen; its removal through the production of acetate, methane, or hydrogen sulfide modulates the efficiency of energy extraction from available nutrients in many ecosystems. We noted that pathway components for acetogenesis are more abundantly and consistently represented in the gut microbiomes of monozygotic twins and their mothers than components for methanogenesis or sulfate reduction and subsequently analyzed the metabolic potential of two sequenced human gut acetogens, Blautia hydrogenotrophica and Marvinbryantia formatexigens in vitro and in the intestines of gnotobiotic mice harboring a prominent saccharolytic bacterium. To do so, we developed a generally applicable method for multiplex sequencing of expressed microbial mRNAs (microbial RNA-Seq) and, together with mass spectrometry of metabolites, showed that these organisms have distinct patterns of substrate utilization. B. hydrogenotrophica targets aliphatic and aromatic amino acids. It increases the efficiency of fermentation by consuming reducing equivalents, thereby maintaining a high NAD(+)/NADH ratio and boosting acetate production. In contrast, M. formatexigens consumes oligosaccharides, does not impact the redox state of the gut, and boosts the yield of succinate. These findings have strategic implications for those who wish to manipulate the hydrogen economy of gut microbial communities in ways that modulate energy harvest.


Figures

FIGURE 1.
FIGURE 1.
Validation of microbial RNA-Seq. A, the correlation between biological replicates at different sequencing depths reached an asymptote above 0.9 for in vivo samples (blue circles, B. thetaiotaomicron in cecum) and in vitro samples (red circles, M. formatexigens grown on MBf medium with melibiose as a carbon source; green circles, B. hydrogenotrophica grown on MA4 medium with tryptone as a carbon source). B, mRNA abundances for RNA samples prepared from the ceca of B. thetaiotaomicron mono-associated mice (n = 4 samples from 4 animals) were highly correlated (r = 0.86) between Affymetrix GeneChip and RNA-Seq platforms. Comparable results were also found for bi-associations of B. thetaiotaomicron with B. hydrogenotrophica and M. formatexigens (n = 5 replicates each). Most of the discrepancies between the two methods involved transcripts detected at higher levels by RNA-Seq compared with GeneChip. C, the sequencing depth required to detect differential gene expression for microbial community members at different relative abundances was estimated by calculating the overlap between the fraction of genes differentially expressed at a given fold change threshold for a complete sample (M. formatexigens RNA; each of two replicate cultures grown in MBf medium plus melibiose or xylose) versus subsamples of the complete sample. With 200,000 reads, all 10-fold changes were found with zero false positives (blue circles). 6- and 3-fold changes (green and red circles, respectively) required greater sequencing depths to identify >80% of the differentially expressed genes. See Figs. S4 and S5 for additional analyses.
FIGURE 2.
FIGURE 2.
The impact of two human gut acetogens on microbial metabolism in the ceca of gnotobiotic mice. A, multiplex RNA-Seq analysis of the B. hydrogenotrophica transcriptome. The heat map shows selected B. hydrogenotrophica genes, expressed in the ceca of B. thetaiotaomicron (Bt)/B. hydrogenotrophica (Bh) bi-associated mice and in vitro during growth of B. hydrogenotrophica in MA4 medium containing nine different substrates. PPDE > 0.99. Carbon sources were supplied at 1% w/v. The maximal relative expression across a row is red; the minimum is green. stat, stationary phase (note that all other cultures were harvested during mid-log phase). Rumhyd is the locus tag for B. hydrogenotrophica (previously known as R. hydrogenotrophicus). PTS, phosphotransferase system. B, targeted tandem mass spectrometry analysis of amino acid levels. C, nontargeted GC/MS analysis of cecal contents. The data are expressed as unit-less peak areas, normalized to the total ion chromatogram for the cecal sample. 3-IAA, 3-indoleacetic acid; 4-HPA, 4-hydroxyphenylacetic acid. D–H, cecal contents from mice, colonized with either acetogen plus B. thetaiotaomicron or with B. thetaiotaomicron alone, were assayed for NAD+, NADH (D; n = 4–5/group), polyglucose- and polyfructose-containing polysaccharides (E; n = 14–15/group), acetate (F; n = 14–15 animals/group), succinate (G; n = 14–15/group), and propionate (H; n = 14–15/group). The mean values ± S.E. are plotted. *, p < 0.05 based on analysis of variance, except B and C (Student's t test). Quantitative PCR assays revealed the following levels of colonization in the different groups of mice studied: B. thetaiotaomicron mono-association, 7.5 × 10¹⁰ ± 1.3 × 10¹⁰ genome equivalents/g of wet cecal content, B. thetaiotaomicron/B. hydrogenotrophica bi-association, 6.5 × 10¹⁰ ± 9.3 × 10⁹ (B. thetaiotaomicron), 9.4 × 10⁹ ± 2.1 × 10⁹ (B. hydrogenotrophica), and B. thetaiotaomicron/M. formatexigens (Mf) bi-association, 3.1 × 10¹⁰ ± 6.3 × 10⁹ (B. thetaiotaomicron), 8.4 ± 109 ± 6.3 × 10⁸ (M. formatexigens); n = 4–5 animals group (three independent experiments).

References

    1. Ley R. E., Lozupone C. A., Hamady M., Knight R., Gordon J. I. (2008) Nat. Rev. Microbiol. 6, 776–788 - PMC - PubMed
    1. Flint H. J., Bayer E. A., Rincon M. T., Lamed R., White B. A. (2008) Nat. Rev. Microbiol. 6, 121–131 - PubMed
    1. Macfarlane S., Macfarlane G. T. (2003) Proc. Nutr. Soc. 62, 67–72 - PubMed
    1. Wolin M. J., Miller T. L. (1983) Fed. Proc. 42, 109–113 - PubMed
    1. McNeil N. I. (1984) Am. J. Clin. Nutr. 39, 338–342 - PubMed

Publication types

Associated data