. 2010 Jul 9;285(28):21807-16.
doi: 10.1074/jbc.M109.084434. Epub 2010 May 5.

Tracking mutant huntingtin aggregation kinetics in cells reveals three major populations that include an invariant oligomer pool

Affiliations

Tracking mutant huntingtin aggregation kinetics in cells reveals three major populations that include an invariant oligomer pool

Maya A Olshina et al. J Biol Chem. .

Abstract

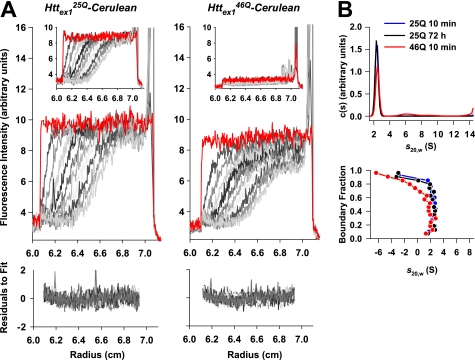
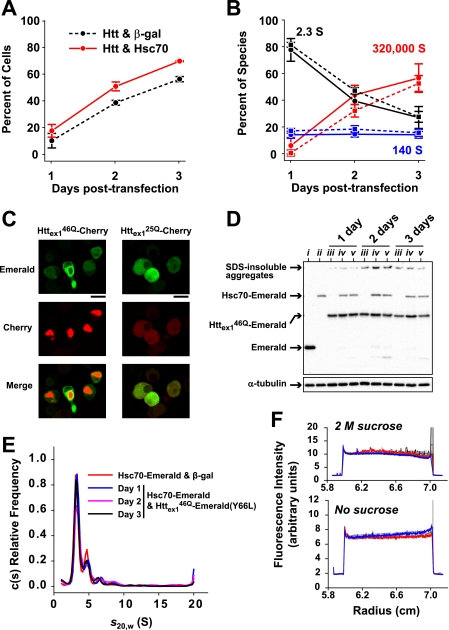
Huntington disease is caused by expanded polyglutamine sequences in huntingtin, which procures its aggregation into intracellular inclusion bodies (IBs). Aggregate intermediates, such as soluble oligomers, are predicted to be toxic to cells, yet because of a lack of quantitative methods, the kinetics of aggregation in cells remains poorly understood. We used sedimentation velocity analysis to define and compare the heterogeneity and flux of purified huntingtin with huntingtin expressed in mammalian cells under non-denaturing conditions. Non-pathogenic huntingtin remained as hydrodynamically elongated monomers in vitro and in cells. Purified polyglutamine-expanded pathogenic huntingtin formed elongated monomers (2.4 S) that evolved into a heterogeneous aggregate population of increasing size over time (100-6,000 S). However, in cells, mutant huntingtin formed three major populations: monomers (2.3 S), oligomers (mode s(20,w) = 140 S) and IBs (mode s(20,w) = 320,000 S). Strikingly, the oligomers did not change in size heterogeneity or in their proportion of total huntingtin over 3 days despite continued monomer conversion to IBs, suggesting that oligomers are rate-limiting intermediates to IB formation. We also determined how a chaperone known to modulate huntingtin toxicity, Hsc70, influences in-cell huntingtin partitioning. Hsc70 decreased the pool of 140 S oligomers but increased the overall flux of monomers to IBs, suggesting that Hsc70 reduces toxicity by facilitating transfer of oligomers into IBs. Together, our data suggest that huntingtin aggregation is streamlined in cells and is consistent with the 140 S oligomers, which remain invariant over time, as a constant source of toxicity to cells irrespective of total load of insoluble aggregates.


Figures

FIGURE 1.
FIGURE 1.
Hydrodynamic properties of recombinant Httex1-Cerulean monomers. A, sedimentation velocity analysis of Httex125Q-Cerulean and Httex146Q-Cerulean at high speed (50,000 rpm). The initial data acquisition scans are shown in red and indicate all Httex1-Cerulean to be in solution. The remaining scans at subsequent time points are shown in incrementing grayscale (note the scans may be overlapping). The data were fitted to a c(s) continuous size distribution, which best describes the behavior of small, diffusing particles (residuals to the c(s) fit are shown in the lower panels). The inset shows the sedimentation behavior of samples incubated for 72 h at 37 °C prior to data analysis. B, sedimentation coefficient distributions based on the fits in A for the c(s) analysis (top panel); note the overlapping data for the Httex125Q-Cerulean samples. An alternate mode of analysis, the van Holde-Weischet analysis, which qualitatively describes the heterogeneity of sedimentation coefficients (lower panel) similarly indicates a population at 2–2.5 S.
FIGURE 2.
FIGURE 2.
Kinetic assessment of aggregate size formed by recombinant Httex1-Cerulean aggregates by low speed centrifugation (3,000 rpm). A, under these conditions, only large aggregates form sedimenting boundaries, whereas monomers do not sediment (resulting in a plateau). The first scan is shown in red, with subsequent scans in incrementing grayscale. The data for the 72-h incubated Httex146Q-Cerulean were fitted to a ls-g*(s) continuous size distribution, which best describes the behavior of very large particles that have negligible diffusion (residuals to the fit shown in the inset). B, percentage of Httex146Q-Cerulean partitioned in the sedimenting boundary after different incubation times, reflecting a transfer of monomers to aggregates over time. C, time-dependent changes in aggregate size heterogeneity and sedimentation coefficients of aggregated Httex146Q-Cerulean were revealed by fits to ls-g*(s) size distributions at the different time points.
FIGURE 3.
FIGURE 3.
Hydrodynamic assessment of Httex1-Emerald monomers in Neuro2a lysates by sedimentation velocity analysis. A, Western blot shows the expression levels over 2 days. Only Httex146Q-Emerald forms SDS-insoluble material over 2 days, indicative of aggregates. B, confocal microscopy shows Httex125Q-Emerald to remain distributed evenly through the cytosol of Neuro2a cells after 2 days. In contrast, the Httex146Q-Emerald forms punctate IBs in many cells. C, high speed sedimentation velocity analysis (50,000 rpm) of Httex1-Emerald in the lysate (0.5 mg/ml total protein) after 2 days of expression. The first scan is shown in red, with subsequent scans in incrementing grayscale. The first scan shows a fast pile up of material at the bottom for Httex146Q-Emerald for a fraction of the material. The lower panels show residuals to fits to a c(s) distribution. D, the sedimenting boundaries for Httex1-Emerald dictate a highly monodisperse population (elongated monomers) when assessed by c(s) analysis (upper panel) or van Holde-Weischet analysis (lower panel). Zoomed in rescaling of the c(s) distributions shows a minor fraction of material to sediment at 3–8 S (inset of upper panel).
FIGURE 4.
FIGURE 4.
Quantification of in-cell aggregate size heterogeneity with low speed and high viscosity (2 m sucrose) sedimentation velocity experiments (0.5 mg/ml total protein). A, sedimentation velocity analysis of the Httex146Q-Emerald at low speed (3,000 rpm). The first scan is shown in red and in the absence of sucrose indicates a proportion of material that has already piled up on the bottom. The remaining sedimenting boundary (incrementing grayscale) was fitted to an ls-g*(s) size distribution (residuals to fit shown in the lower panels). Sedimentation was slowed by increasing the viscosity with 2 m sucrose. B, sedimentation velocity analysis of Httex125Q-Emerald at low speed (3,000 rpm). Here, there is no sedimentation in the presence or absence of 2 m sucrose, indicative of a lack of aggregates. For comparison, lysates expressing β-galactosidase showed negligible signal intensity under the same photomultiplier voltage as Httex125Q-Emerald (purple scans), indicating negligible nonspecific fluorescence contributions to the samples. C, ls-g*(s) size distributions detected at low speed (3,000 rpm) for the oligomer boundary detected in the absence of sucrose (left) and IBs from the boundary detected in 2 m sucrose (right). Data shown are the mean ± S.D. of fits to three independent preparations of lysates.
FIGURE 5.
FIGURE 5.
The influence of Hsc70 on the evolution of three discrete species of Httex146Q-Emerald in Neuro2a cells over 3 days of transient expression. A, the percentage of cells expressing Httex146Q-Emerald containing IBs prior to lysis for assessment by SV analysis. Httex146Q-Emerald was co-expressed with Hsc70-Emerald(Y66L) or β-galactosidase. Values are mean ± S.D. (error bars) (n = 3 separate transfections). B, the relative population of 2.3 S monomers, 140 S oligomers, and 320,000 S IBs as assessed by SV analysis (dashed line, Httex146Q-Emerald and β-galactosidase; solid line, Httex146Q-Emerald and Hsc70-Emerald(Y66L)). Values are mean ± S.D. (n = 3 separate transfections). C, the localization of Hsc70-Emerald and Httex1-Cherry in Neuro2a cells after 3 days of transfection (imaged by confocal microscopy). Hsc70-Emerald is enriched at the periphery of the IBs in cells expressing Httex146Q-Cherry and remains diffuse in cells expressing Httex125Q-Cherry. Scale bar, 20 μm. D, Western blot probed with anti-GFP (top) and anti-α-tubulin (bottom) antibodies shows the expression levels and the presence of SDS-insoluble material over 3 days for the samples in A and B. Samples shown include Emerald and β-galactosidase (3-day expression; i), Hsc70-Emerald and β-galactosidase (3-day expression; ii), Httex146Q-Emerald and β-galactosidase (iii), Httex146Q-Emerald and Hsc70-Emerald(Y66L) (iv), and Httex146Q-Emerald(Y66L) and Hsc70-Emerald (v). For all combinations, equivalent masses of DNA were used in the transfections. E, c(s) size distributions of high speed (50,000 rpm) SV analysis showed no detectable interactions between Hsc70-Emerald and Httex146Q-Emerald(Y66L). F, ls-g*(s) size distributions of low speed (3,000 rpm) SV analysis showed no co-sedimentation of Hsc70-Emerald with Httex146Q-Emerald(Y66L) 140 S oligomers or 320,000 S IBs. The first scan is shown in red, the last scan is shown in blue, and intermediate scans are shown in grayscale (note that many are overlapping due to lack of sedimentation).

Similar articles

Cited by

References

    1. Chiti F., Dobson C. M. (2006) Annu. Rev. Biochem. 75, 333–366 - PubMed
    1. Scherzinger E., Lurz R., Turmaine M., Mangiarini L., Hollenbach B., Hasenbank R., Bates G. P., Davies S. W., Lehrach H., Wanker E. E. (1997) Cell 90, 549–558 - PubMed
    1. Arrasate M., Mitra S., Schweitzer E. S., Segal M. R., Finkbeiner S. (2004) Nature 431, 805–810 - PubMed
    1. Takahashi Y., Okamoto Y., Popiel H. A., Fujikake N., Toda T., Kinjo M., Nagai Y. (2007) J. Biol. Chem. 282, 24039–24048 - PubMed
    1. Takahashi T., Kikuchi S., Katada S., Nagai Y., Nishizawa M., Onodera O. (2007) Hum. Mol. Genet. 17, 345–346 - PubMed

Publication types