. 2010 Jul;84(14):7064-72.
doi: 10.1128/JVI.02400-09. Epub 2010 May 5.

Merkel cell polyomavirus-infected Merkel cell carcinoma cells require expression of viral T antigens

Affiliations

Merkel cell polyomavirus-infected Merkel cell carcinoma cells require expression of viral T antigens

Roland Houben et al. J Virol. 2010 Jul.

Abstract

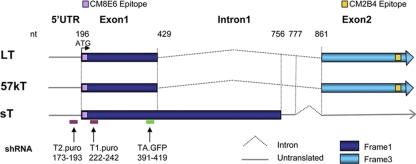
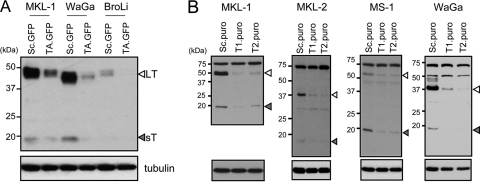
Merkel cell carcinoma (MCC) is the most aggressive skin cancer. Recently, it was demonstrated that human Merkel cell polyomavirus (MCV) is clonally integrated in approximately 80% of MCC tumors. However, direct evidence for whether oncogenic viral proteins are needed for the maintenance of MCC cells is still missing. To address this question, we knocked down MCV T-antigen (TA) expression in MCV-positive MCC cell lines using three different short hairpin RNA (shRNA)-expressing vectors targeting exon 1 of the TAs. The MCC cell lines used include three newly generated MCV-infected cell lines and one MCV-negative cell line from MCC tumors. Notably, all MCV-positive MCC cell lines underwent growth arrest and/or cell death upon TA knockdown, whereas the proliferation of MCV-negative cell lines remained unaffected. Despite an increase in the number of annexin V-positive, 7-amino-actinomycin D (7-AAD)-negative cells upon TA knockdown, activation of caspases or changes in the expression and phosphorylation of Bcl-2 family members were not consistently detected after TA suppression. Our study provides the first direct experimental evidence that TA expression is necessary for the maintenance of MCV-positive MCC and that MCV is the infectious cause of MCV-positive MCC.


Figures

FIG. 1.
FIG. 1.
Structure of the exon 1 and exon 2 junctions for MCV T-antigen mRNAs. The large T (LT) and 57kT proteins are identically encoded by exon 1 and exon 2 but differ due to downstream alternative splicing in exon 2 (not shown). sT translation extends beyond the LT/57kT exon 1 donor site but does not include exon 2. Antibody CM8E6 recognizes all TAs, whereas CM2B4 detects only the LT and 57kT proteins encoded by exon 2. The sequences targeted by the three TA shRNAs used in this study are located within shared regions of exon 1 and are anticipated to target all TA isoforms.
FIG. 2.
FIG. 2.
T-antigen expression in MCC cell lines. Total-cell lysates of the indicated cell lines were analyzed by immunoblotting with antibodies CM2B4 (A) and CM8E6 (B). MCC cell lines MKL-1, WaGa, BroLi, MS-1, and MKL-2 express MCV TAs, whereas UISO, MCC13, and MaTi are negative for MCV infection (nonspecific 60-kDa and 75-kDa bands are also detected by CM2B4 and CM8E6, respectively). LT sizes differ among MCC cell lines and also differ from the size of full-length LT206 expressed in 293 cells, consistent with different carboxyl truncation mutations in different MCV-positive cell lines. Tubulin expression was determined as a protein loading control.
FIG. 3.
FIG. 3.
Knockdown of T-antigen expression using green fluorescent protein (GFP)-expressing and puromycin-selectable lentiviral shRNA vectors. Total-cell lysates were analyzed for LT (open arrowhead) and sT (filled arrowhead) expression by immunoblotting using antibody CM8E6. (A) The indicated MCC cell lines were infected with the lentiviral shRNA vector KH1, encoding GFP and either a shRNA targeting all MCV TA mRNAs (TA.GFP) or a scrambled shRNA (Sc.GFP). The infection rates in this particular experiment were determined to be 79% (MKL-1 TA.GFP), 91% (WaGa TA.GFP), and 81% (BroLi TA.GFP). Knockdown was examined at day 5 postinfection. (B) The indicated MCC cell lines were infected with the lentiviral shRNA vector pLKO, encoding puromycin resistance and either a shRNA targeting all MCV TA mRNAs (T1.puro and T2.puro) or a scrambled shRNA (Sc.puro). To eliminate uninfected cells, puromycin (1 μg/ml) was added to the culture medium at day 2 after infection, and infected cells were selected for 4 days. Knockdown was examined at day 6 postinfection for MKL-1, MKL-2, and MS-1 cells and at day 10 for WaGa cells.
FIG. 4.
FIG. 4.
Altered growth properties of MCV-positive MCC cell lines upon T-antigen knockdown. (A) The indicated cell lines were infected with the lentiviral shRNA vector KH1, encoding GFP and either a shRNA targeting all MCV TA mRNAs (TA.GFP) or a scrambled shRNA (Sc.GFP); infected cells show green fluorescence. To examine altered growth properties upon TA knockdown, the infected, green fluorescent cells were mixed with uninfected, nonfluorescent cells on day 1 postinfection; subsequently, changes in the ratio of green fluorescent to nonfluorescent cells were measured over time. The ratios on day 4 were set to 1. The upper row shows results for MCV-positive cell lines (MKL-1, WaGa, BroLi, MKL-2, and MS-1), and the lower row shows those for MCV-negative cell lines (MCC13, MaTi, UISO, FM88, and Jurkat). Each graph represents mean values (± standard deviations) for at least three independent experiments. The exact number of independent experiments is indicated. (B) The indicated cell lines were infected with the lentiviral shRNA vector pLKO, encoding puromycin and either a shRNA targeting all MCV TA mRNAs (T1.puro and T2.puro) or a scrambled shRNA (Sc.puro). At 48 h after infection, 2.5 × 10⁴ infected MCV-positive cells (MKL-1, MKL-2, and MS-1) and 104 infected MCV-negative UISO cells were seeded, and growth was monitored over time in the presence of puromycin (1 μg/ml). For the WaGa cell line, 2.5 × 10⁴ cells were seeded at day 8 postinfection after puromycin selection. The growth properties of the shRNA infected cells were measured by the Wst-1 assay.
FIG. 5.
FIG. 5.
Induction of cell death but lack of caspase activation upon T-antigen knockdown. The indicated MCC cells were infected with the indicated lentiviral constructs expressing either a shRNA targeting all MCV TA mRNAs (TA.GFP) or a scrambled shRNA (Sc.GFP). (A) Cells were subjected to double staining with annexin V and 7-AAD on day 7 postinfection; to restrict measurements to living, infected cells, only green fluorescent cells were analyzed. The early apoptotic cells are identified as the 7-AAD annexin V+ cells. Each bar represents the mean value (+ standard error) for the indicated number of independent experiments. Statistical analysis was done using the Mann-Whitney test (*, P < 0.05; **, P < 0.005). (B) Immunoblot analysis for cleaved PARP, caspase 9, and caspase 3 proteins in total-cell lysates from the indicated cells on day 5 post-shRNA infection. The induction of cleaved PARP and caspase proteins after a 16-h doxorubicin (1.0 μM) treatment demonstrates that functional apoptotic pathways remain intact in these cell lines.
FIG. 6.
FIG. 6.
Decreased cell cycle progression upon T-antigen knockdown in MCV-positive MCC cells. (A) Cells were infected with the indicated lentiviral constructs expressing either a shRNA targeting all MCV TA mRNAs (TA.GFP) or a scrambled shRNA (Sc.GFP). The cellular DNA content was determined by PI staining of fixed cells. The percentage of cells with >2N DNA content on day 7 following infection with Sc.GFP or TA.GFP is given. Each bar represents the mean value (+ standard error) for the indicated number of independent experiments. Statistical analysis was done using the Mann-Whitney test (*, P < 0.05). (B) The two PI-A/PI-W dot blots demonstrate the gating strategy used to exclude cellular doublets or doublets and dead sub-G1 cells. Note the large sub-G1 fraction that is also visible in the histogram blots of Sc.GFP-infected cells. The percentages of cells in the S and G2 phases of the cell cycle were estimated in histogram blots after exclusion of the doublets and sub-G1 cells. (C) MKL-1 or WaGa cells infected with Sc.puro or T1.puro were labeled with 10 μM BrdU for 3 h at day 8 postinfection. BrdU incorporated into the cellular DNA was stained with an anti-BrdU monoclonal antibody followed by PI staining. BrdU-positive cell populations (red) are merged to the cell cycle profile.
FIG. 7.
FIG. 7.
Bcl-2 family protein expression and phosphorylation and p53 expression after T-antigen knockdown in MCV-positive MCC cells. Total-cell lysates derived from cells on day 6 following infection with either a scrambled shRNA (Sc.puro or Sc.GFP) or a TA-directed shRNA construct (T1.puro, T2.puro, or TA.GFP) were analyzed by immunoblotting. (A and B) The expression of antiapoptotic (A) and proapoptotic (B) Bcl-2 family members is exemplified for MKL-1 cells. (C) Differential Bcl-xL and Bax expression upon TA knockdown with respect to cell line and knockdown strategy. (D) Total p53 protein was analyzed in MCC cell lines infected with Sc.puro or T1.puro. Filled arrowheads indicate truncated LT proteins.

References

    1. Ahuja, D., M. T. Saenz-Robles, and J. M. Pipas. 2005. SV40 large T antigen targets multiple cellular pathways to elicit cellular transformation. Oncogene 24:7729-7745. - PubMed
    1. Arroyo, J. D., and W. C. Hahn. 2005. Involvement of PP2A in viral and cellular transformation. Oncogene 24:7746-7755. - PubMed
    1. Bakker, A. B. H., J. H. Phillips, C. G. Figdor, and L. L. Lanier. 1998. Killer cell inhibitory receptors for MHC class I molecules regulate lysis of melanoma cells mediated by NK cells, γδ T cells, and antigen-specific CTL. J. Immunol. 160:5239-5245. - PubMed
    1. Becker, J. C., R. Houben, S. Ugurel, U. Trefzer, C. Pfohler, and D. Schrama. 2009. MC polyomavirus is frequently present in Merkel cell carcinoma of European patients. J. Investig. Dermatol. 129:248-250. - PubMed
    1. Becker, J. C., D. Schrama, and R. Houben. 2009. Merkel cell carcinoma. Cell. Mol. Life Sci. 66:1-8. - PMC - PubMed

Publication types

MeSH terms

Substances