. 2010 Jul 1;21(13):2241-56.
doi: 10.1091/mbc.e09-11-0930. Epub 2010 May 5.

Rapid lytic granule convergence to the MTOC in natural killer cells is dependent on dynein but not cytolytic commitment

Affiliations

Rapid lytic granule convergence to the MTOC in natural killer cells is dependent on dynein but not cytolytic commitment

Ashley N Mentlik et al. Mol Biol Cell. .

Abstract

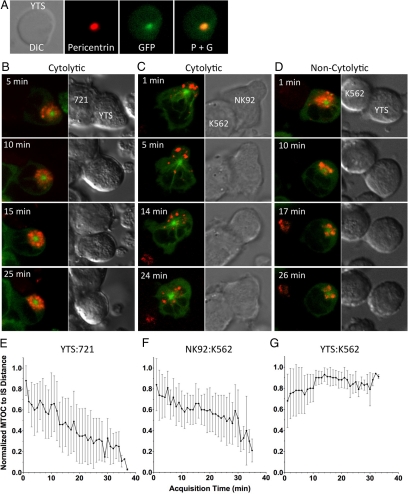
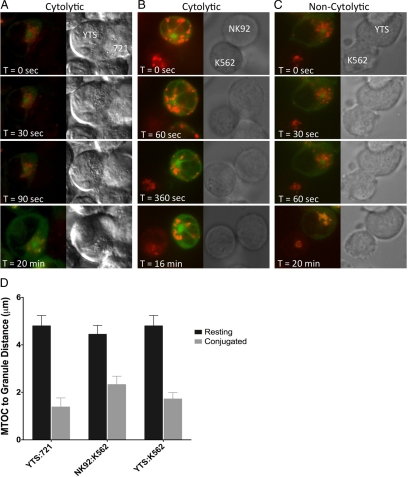
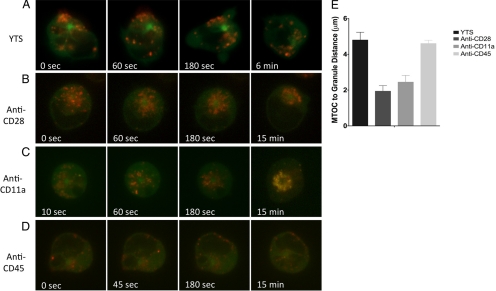
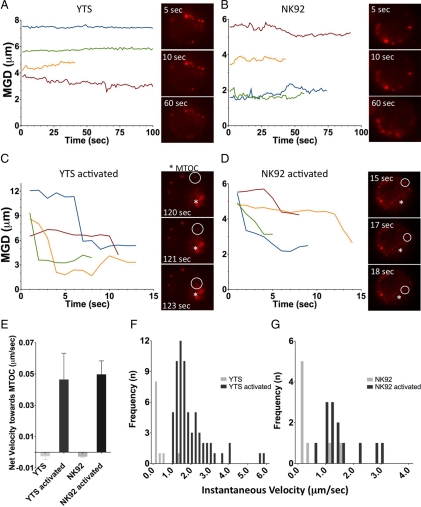
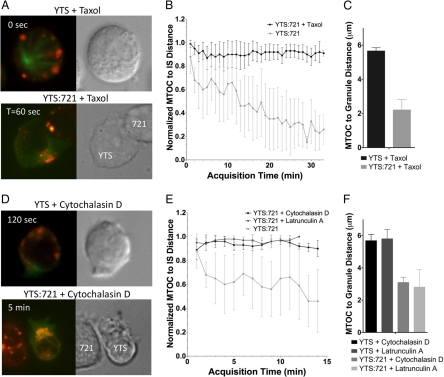
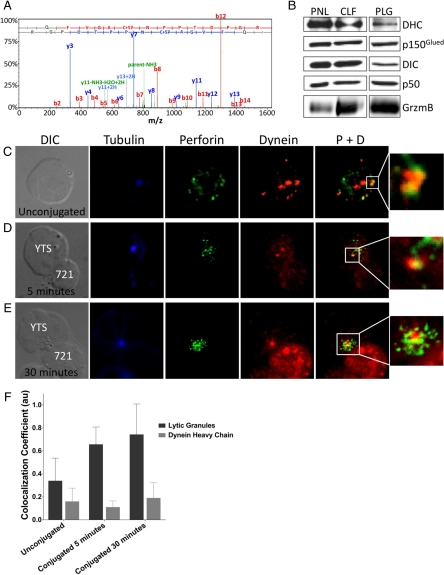
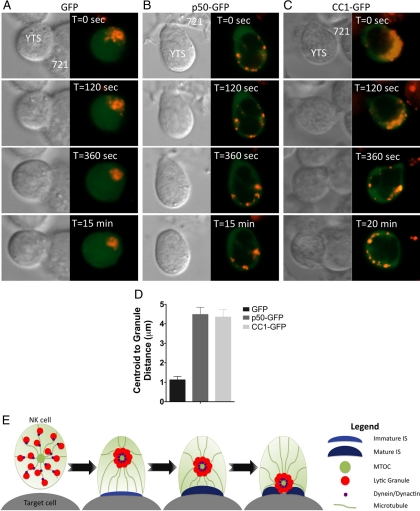
Natural killer cells are lymphocytes specialized to participate in host defense through their innate ability to mediate cytotoxicity by secreting the contents of preformed secretory lysosomes (lytic granules) directly onto a target cell. This form of directed secretion requires the formation of an immunological synapse and occurs stepwise with actin reorganization preceding microtubule-organizing center (MTOC) polarization to the synapse. Because MTOC polarization to the synapse is required for polarization of lytic granules, we attempted to define their interrelationship. We found that compared with the time required for MTOC polarization, lytic granules converged to the MTOC rapidly. The MTOC-directed movement of lytic granules was independent of actin and microtubule reorganization, dependent on dynein motor function, occurred before MTOC polarization, and did not require a commitment to cytotoxicity. This defines a novel paradigm for rapid MTOC-directed transport as a prerequisite for directed secretion, one that may prepare, but not commit cells for precision secretory function.


Figures

Figure 1.
Figure 1.
Dynamics of MTOC movement relative to the NK cell IS. (A) DIC (left) and overlay of fluorescent images (right) of a YTS GFP-tubulin cell fixed and stained with anti-pericentrin polyclonal antibody are shown. Green, GFP-tubulin; red, pericentrin antibody as identified using an AlexaFluor-conjugated anti-rabbit mAb. (B–D) Time-lapse images of MTOC movement in a YTS GFP-tubulin cell conjugated with a susceptible 721.221 target cell (B; from Supplemental Video 1), an NK92 GFP-tubulin cell conjugated with a susceptible K562 target cell (C; from Supplemental Video 2), and a YTS GFP-tubulin cell conjugated with a nonsusceptible K562 target cell (D; from Supplemental Video 3). Each image pair shows confocal immunofluorescence in the plane of the MTOC on the left and DIC on the right. Green, GFP-tubulin; red, LysoTracker–loaded acidified lysosomes. Mean distance between the MTOC and the IS (error bars, ±SD), normalized to the largest distance of the MTOC from the IS in that cell, as a function of conjugation time in (E) YTS with 721.221 cells (n = 10), (F) NK92 with K562 cells (n = 9), and (G) YTS with K562 cells (n = 10).
Figure 2.
Figure 2.
Dynamics of lytic granule movement relative to the MTOC in unconjugated or target cell–conjugated NK cells. (A–C) Time-lapse images of lytic granule movement in conjugates between a YTS GFP-tubulin and a susceptible 721.221 target cell (A), an NK92 GFP-tubulin and a susceptible K562 target cell (B), and a YTS GFP-tubulin and a nonsusceptible K562 target cell (C). In each pair of images, confocal immunofluorescence in the plane of the MTOC is shown on the left and DIC on the right. Green, GFP-tubulin; red, LysoTracker-loaded acidified lysosomes. T = 0 refers to the time that image acquisition began, which was between 1 and 5 min after NK cells were added to the imaging chamber. (D) Quantitative analysis of lytic granule movement relative to the MTOC as measured by mean MTOC to granule distance in individual time points averaged over all measured time points (error bars, ±SD) in conjugates between YTS and 721.221 target cells (n = 10), NK92 and K562 target cells (n = 9), and YTS and K562 target cells (n = 10). All mean distances of lytic granules from the MTOC were significantly different in conjugates compared with unconjugated NK cells (p < 0.05).
Figure 3.
Figure 3.
Dynamics of lytic granule movement to the MTOC in NK cells induced by immobilized antibodies against cell-surface receptors. (A–D) Time-lapse frames from Supplemental Video 4 of lytic granule movement in a YTS GFP-tubulin cell on an uncoated surface (A), YTS GFP-tubulin cell on an anti-CD28-coated surface (B), YTS GFP-tubulin cell on an anti-CD11a-coated surface (C), and YTS GFP-tubulin cell on an anti-CD45-coated surface (D). In each image, confocal immunofluorescence in the plane of the MTOC is shown. Green, GFP-tubulin; red, LysoTracker-loaded acidified lysosomes. Zero seconds represents the time at which the NK cell appears to contact the glass surface. (E) Quantitative analyses of lytic granule movement relative to the MTOC measured by mean MTOC to granule distance in individual time points averaged over all measured time points (error bars, ±SD) in 9–10 YTS cells per condition. Mean distances of lytic granules from the MTOC in NK cells on anti-CD28– and anti-CD11a– but not anti-CD45–coated surfaces were significantly different from unconjugated NK cells (p < 0.05).
Figure 4.
Figure 4.
Quantitative analyses of rapid lytic granule movement relative to the MTOC in NK cells. Distance of individual LysoTracker Red–loaded lytic granules from the MTOC as a function of time in a single cell and as visualized in a streaming video sequences in resting YTS GFP-tubulin (A), or NK92 GFP-tubulin (B) cells, and YTS GFP-tubulin cells on an anti-CD28-coated surface (C) or NK92 GFP-tubulin cells on an anti-NKp30–coated surface (D). Times listed in images represent seconds elapsed after the NK cell contacted the glass surface. The MTOC as defined by GFP fluorescent acquisition (not shown) is marked with an asterisk (*), and a white circle tracks an individual moving lytic granule. The line graphs shown each demonstrate four representative single lytic granule tracks, with T = 0 representing the first identification of that granule. In activated NK cells these had a total displacement of >1 μm as did >50% of all granules identified. (E) Mean net velocity of all measured lytic granules over their entire tracks (error bars, ±SD). Each bar represents three cells accounting for 58–141 measured lytic granule tracks; means in activated YTS and NK92 cells were significantly different from resting cells (p = 0.045 and p = 0.0036, respectively). Histogram of instantaneous velocities of all MTOC-directed lytic granules in YTS GFP-tubulin (F) and NK92 GFP-tubulin cells (G), as they moved toward the MTOC with a displacement of ≥1 μm. Instantaneous velocities in activated YTS and NK92 cells were significantly different from those in resting cells (p < 0.0001 and p = 0.0035, respectively).
Figure 5.
Figure 5.
Dynamics of MTOC movement relative to the IS and lytic granule movement relative to the MTOC in unconjugated or target cell–conjugated eNK cells. Time-lapse images of individual eNK cells nucleofected with GFP-tubulin deposited onto an uncoated surface (A) or in conjugation with a susceptible K562 target cell (B; Supplemental Video 9). (B) DIC (top) and confocal immunofluorescence in the plane of the MTOC (bottom). Green, GFP-tubulin; red, LysoTracker-loaded acidified lysosomes. Zero seconds represents the time at which the NK cell appears to contact either the imaging surface or the target cell. (C) Quantitative analyses of mean distance between the MTOC and the IS (error bars, ±SD) normalized to the largest distance of the MTOC from the IS as a function of time. (D) Lytic granule movement relative to the MTOC as a function of time measured by mean MTOC to granule distance in individual time points averaged over all measured time points in nine cells; error bars, ±SD. Mean distance of lytic granules from the MTOC in conjugated eNK cells was significantly different from that in unconjugated eNK cells (p < 0.05).
Figure 6.
Figure 6.
Taxol, cytochalasin D, or latrunculin A treatment does not prevent lytic granule movement to the MTOC in NK cells after target cell conjugation. Images of YTS GFP-tubulin cells treated with taxol (A; Supplemental Video 10) or cytochalasin D (D; Supplemental Video 11) unconjugated or conjugated with a susceptible 721.221 target cell. In each, confocal immunofluorescence in the plane of the MTOC is shown (left; green, GFP-tubulin; red, LysoTracker-loaded acidified lysosomes) and DIC (right). Zero seconds defines the time at which the NK cell appears to contact either the imaging surface or the target cell. (B and E) Quantitative analyses of mean distance (error bars, ±SD) between the MTOC and the IS normalized to the farthest distance of the MTOC from the IS as a function of time in (B) taxol-treated or (E) cytochalasin D– or latrunculin A–treated YTS GFP-tubulin cells conjugated with susceptible 721.221 target cells (n = 10, 8, and 8, respectively). (C and F) Mean MTOC to lytic granule distance in individual time points averaged over all measured time points (error bars, ±SD) in (C) taxol-treated or (F) cytochalasin D– or latrunculin A–treated YTS GFP-tubulin cells conjugated with susceptible 721.221 target cells. Lytic granule distance from the MTOC in drug-treated conjugated NK cells was significantly different from unconjugated drug-treated NK cells (p < 0.05).
Figure 7.
Figure 7.
LFA-1 blockade prevents lytic granule movement to the MTOC in NK cells after target cell conjugation. (A–C) Time-lapse images of lytic granule movement in a YTS GFP-tubulin cell pre-incubated with anti-CD11a and conjugated to a nonsusceptible K562 target cell (A), a YTS GFP-tubulin cell pre-incubated with anti-CD11a and contacting a nonsusceptible K562 target cell (B), and a YTS GFP-tubulin pre-incubated with control IgG and conjugated to a nonsusceptible K562 target cell (C). In each pair of images, confocal immunofluorescence in the plane of the MTOC is shown on the left and DIC on the right. Green, GFP-tubulin; red, LysoTracker-loaded acidified lysosomes. T = 0 refers to the time image acquisition began which was between 1 and 4 min after NK cells were added to the imaging chamber. YTS cells preincubated with anti-CD11a conjugated to nonsusceptible K562 cells in 50% of cell interactions observed, whereas in the other 50% the YTS did not demonstrate membrane deformation and are thus described separately as a contact. YTS cells preincubated with IgG routinely conjugated to K562 cells. (D) Quantitative analysis of lytic granule movement relative to the MTOC as measured by mean MTOC to granule distance in individual time points averaged over all measured time points (error bars, ±SD) in conjugates between anti-CD11a–coated YTS and K562 target cells (n = 10), contacts between anti-CD11a–coated YTS and K562 target cells (n = 10), and conjugates between IgG-coated YTS and K562 target cells (n = 5). Mean distances of lytic granules from the MTOC in anti-CD11a–coated YTS cells were significantly greater than in IgG-coated YTS cells (p < 0.001).
Figure 8.
Figure 8.
Dynein colocalization with perforin-containing lytic granules. (A) Mass spectrometric analysis of one of 32 unique peptides identified as dynein heavy chain in a tryptic digest of a single protein band from a gel electrophoresis of isolated lytic granules. (B) Dynein heavy chain (DHC), p150Glued, dynein intermediate chain (DIC), p50 dynamitin, and granzyme B (GrzmB) Western blot analyses of the postnuclear lysate (PNL), crude lysosomal fraction (CLF), and purified lytic granules (PLG) from density gradient separation of lytic granules from YTS cells. (C–E) Microscopy of fixed cells showing DIC (left) and fluorescence (right) images of YTS cells unconjugated (C) or conjugated to 721.221 cells for 5 (D) or 30 (E) min before fixation and staining with anti-α-tubulin (blue), anti-perforin (green), and anti-dynein heavy chain (red). The rightmost images demonstrate an overlay of perforin and dynein fluorescence, and the smaller image is an enlargement of the region within the white box. The biotinylated anti-tubulin mAb was detected with Pacific Blue-streptavidin, the anti-perforin antibody was directly FITC-conjugated, and the anti-dynein antibody was detected with an AlexaFluor 568–conjugated goat anti-rabbit antibody. (F) Quantitative analyses of colocalization between perforin and dynein fluorescent regions as measured by the colocalization coefficient between the total cellular lytic granule area (black) or total cellular dynein area (gray) as a feature of conjugation time. Data are representative of three separate repeats in which 37–64 cells were evaluated per condition. Error bars, ±SD.
Figure 9.
Figure 9.
Dynein/dynactin activity is required for rapid lytic granule traffic to the MTOC in NK cells. Time-lapse images of YTS cells nucleofected with GFP (A), p50-GFP (B), or CC1-GFP (C) and in conjugation with susceptible 721.221 target cells (Supplemental Video 12). In each pair of images, confocal immunofluorescence in the plane of lytic granules (left; green, overexpressed GFP fusion protein; red, LysoTracker-loaded acidified lysosomes) and DIC (right) are shown. T = 0 refers to the time acquisition began, which was between 0 and 2 min after the NK cells were added to the imaging chamber. (D) Lytic granule movement relative to the centroid of the granules as measured by mean centroid to granule distance over time (error bars, ±SD) in control GFP-, p50-GFP-, or CC1-GFP–nucleofected YTS cells conjugated with susceptible 721.221 target cells (n = 5). All distances of lytic granules from the granule centroid in p50- or CC1-nucleofected conjugates were significantly greater than those in GFP-nucleofected conjugates (p < 0.05). (E) Model of the linear sequence of events leading to directed secretion of lytic granule contents in an NK cell. In the first step, an NK cell recognizes a target cell and the dynein/dynactin complex rapidly transports lytic granules to the MTOC. Next, the lytic granules converge to the MTOC independently of microtubule dynamics or actin reorganization at the IS. Finally, the MTOC gradually polarizes along with the lytic granules to the IS where their contents can be directed onto the target cell.

Similar articles

Cited by

References

    1. Andzelm M. M., Chen X., Krzewski K., Orange J. S., Strominger J. L. Myosin IIA is required for cytolytic granule exocytosis in human NK cells. J. Exp. Med. 2007;204:2285–2291. - PMC - PubMed
    1. Banerjee P. P., Pandey R., Zheng R., Suhoski M. M., Monaco-Shawver L., Orange J. S. Cdc42-interacting protein-4 functionally links actin and microtubule networks at the cytolytic NK cell immunological synapse. J. Exp. Med. 2007;204:2305–2320. - PMC - PubMed
    1. Barber D. F., Faure M., Long E. O. LFA-1 contributes an early signal for NK cell cytotoxicity. J. Immunol. 2004;173:3653–3659. - PubMed
    1. Beal A. M., Anikeeva N., Varma R., Cameron T. O., Vasiliver-Shamis G., Norris P. J., Dustin M. L., Sykulev Y. Kinetics of early T cell receptor signaling regulate the pathway of lytic granule delivery to the secretory domain. Immunity. 2009;31:632–642. - PMC - PubMed
    1. Bryceson Y. T., March M. E., Barber D. F., Ljunggren H. G., Long E. O. Cytolytic granule polarization and degranulation controlled by different receptors in resting NK cells. J. Exp. Med. 2005;202:1001–1012. - PMC - PubMed

Publication types

LinkOut - more resources