. 2010 Jul;104(1):449-62.
doi: 10.1152/jn.01113.2009. Epub 2010 May 5.

Subthreshold membrane conductances enhance directional selectivity in vertebrate sensory neurons

Affiliations

Subthreshold membrane conductances enhance directional selectivity in vertebrate sensory neurons

Maurice J Chacron et al. J Neurophysiol. 2010 Jul.

Abstract

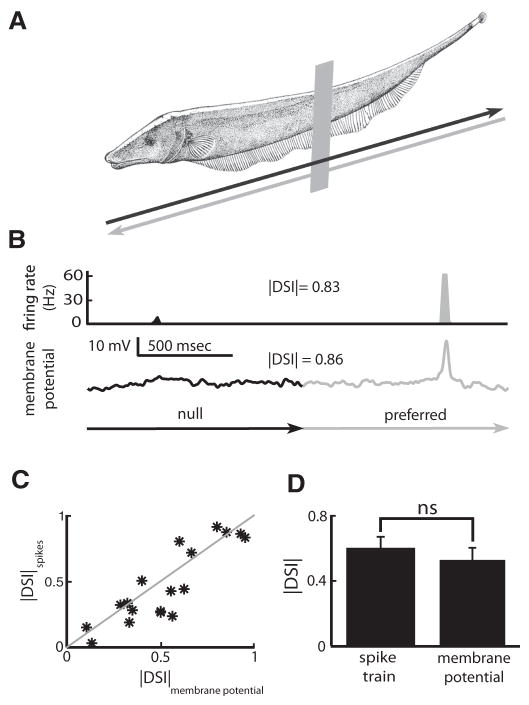
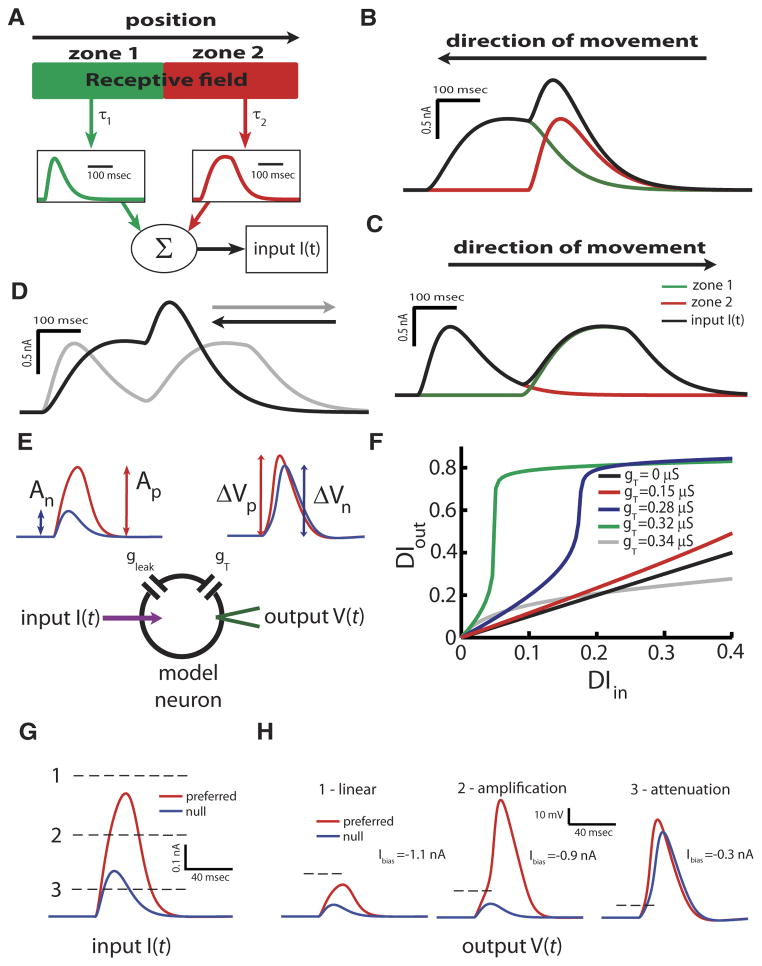
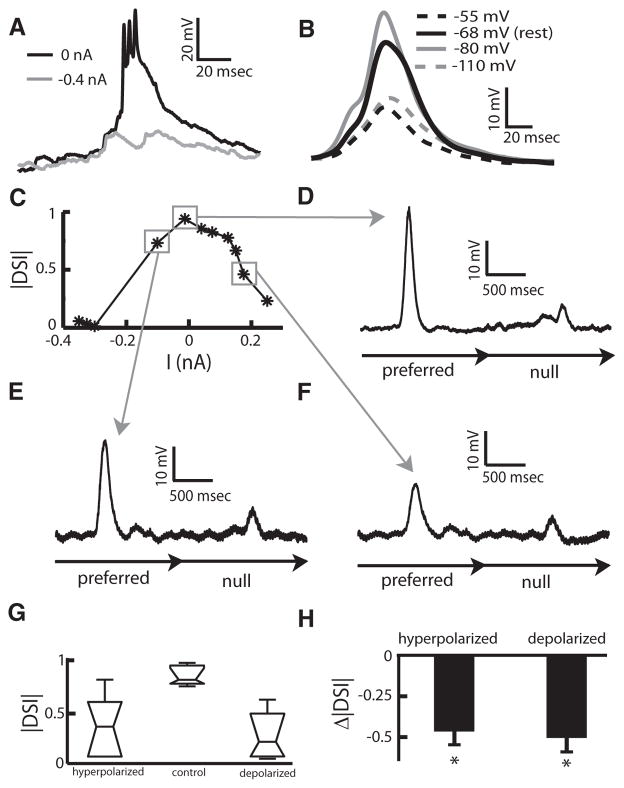
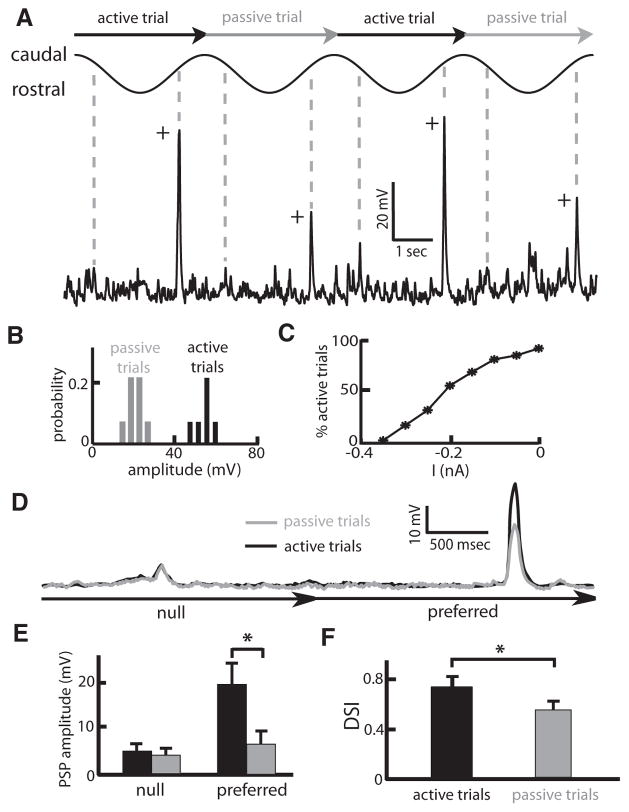
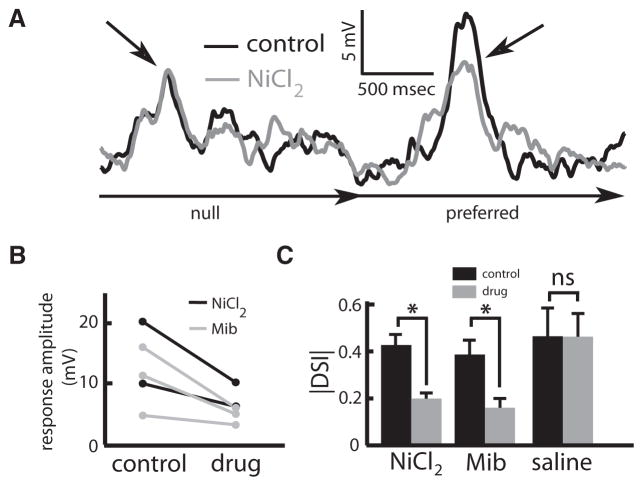
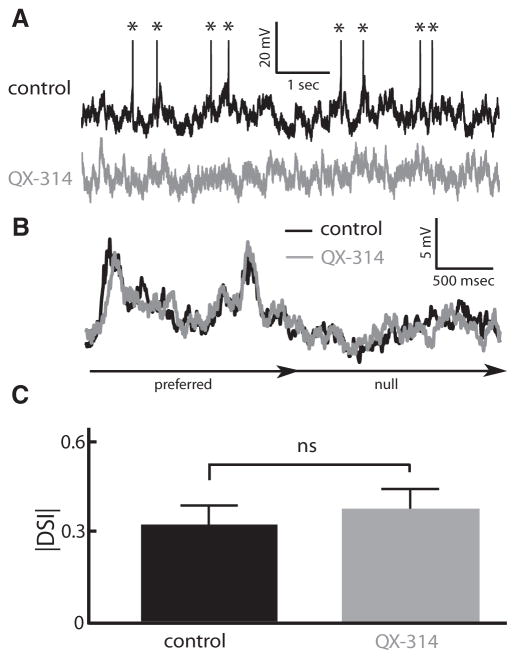
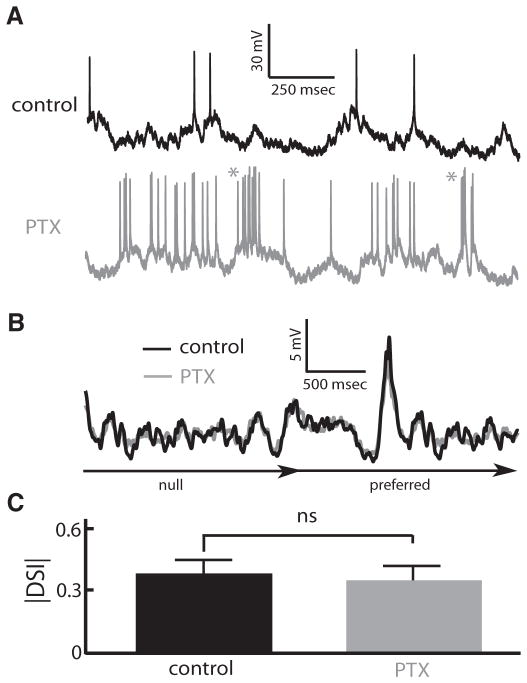
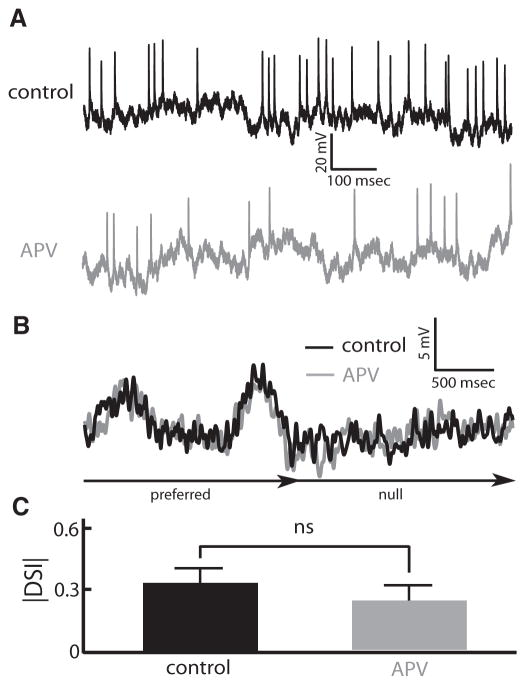
Directional selectivity, in which neurons respond preferentially to one "preferred" direction of movement over the opposite "null" direction, is a critical computation that is found in the central nervous systems of many animals. Such responses are generated using two mechanisms: spatiotemporal convergence via pathways that differ in the timing of information from different locations on the receptor array and the nonlinear integration of this information. Previous studies have showed that various mechanisms may act as nonlinear integrators by suppressing the response in the null direction. Here we show, through a combination of mathematical modeling and in vivo intracellular recordings, that subthreshold membrane conductances can act as a nonlinear integrator by increasing the response in the preferred direction of motion only, thereby enhancing the directional bias. Such subthreshold conductances are ubiquitous in the CNS and therefore may be used in a wide array of computations that involve the enhancement of an existing bias arising from differential spatiotemporal filtering.


Conflict of interest statement

DISCLOSURES

No conflicts of interest, financial or otherwise, are declared by the author(s).

Figures

FIG. 1
FIG. 1
The spiking and subthreshold membrane potential responses of TS neurons display identical directional biases. A: schematic of the experimental setup: a moving object (vertical gray bar) was moved sinusoidally back and forth lateral to the animal. Gray arrow, tail-to-head direction; black arrow, head-to-tail direction. B: example spiking (top) and membrane potential (bottom) of an example TS neuron averaged over stimulus trials. This neuron showed weak or no responses when the object moved from head to tail (black) and strong responses when the object moved from tail to head (gray). Directional selectivity was quantified by comparing the peak responses in both the spike train and membrane potential in both the preferred (i.e., the direction that gave rise to the greatest peak response) and null (i.e., the other direction) directions. The values of |directional selectivity index| (|DSI|) computed from the membrane potential and spike train were 0.86 and 0.83, respectively. C: |DSI| computed from the spike train plotted as a function of |DSI| computed from the membrane potential for our dataset. We observed a strong and significant correlation coefficient between both quantities (R = 0.87, P ≪ 10−3, n = 18) with most datapoints lying across the identity line (gray line). D: population-averaged |DSI| values obtained from the spike train (left) and subthreshold membrane potential (right) responses were not significantly different (P = 0.4961, sign-rank test, n = 18).
FIG. 2
FIG. 2
Modeling the effects of a subthreshold T-type calcium channel on an existing directional bias. A: schematic of the receptive field of a hypothetical neuron that is composed of zones 1 and 2. Zones 1 and 2 differ in their responses to a moving object as they have different temporal profiles that are characterized by different time constants of decay τ1 and τ2, respectively. These responses are summed to give rise to the input I(t). The responses are illustrated for τ1 = 10 ms and τ 2 = 200 ms. B: responses of zone 1 (green), zone 2 (red), and input I(t) (black) when the object moves from right to left. C: responses of zone 1 (green), zone 2 (red), and input I(t) (black) when the object moves from left to right. D: input I(t) when the object moves from left to right (gray) and when the object moves from right to left (black). When the object moves from right to left, there is overlap between the responses from zones 1 and 2 because the object first moves through zone 2, which has the greatest time constant of decay, leading to a greater maximum value for the input I(t). When the object moves from left to right, the amount of overlap between the responses of zones 1 and 2 is less because the object now moves through zone 1 first, which has the lesser time constant of decay, leading to a lesser maximum value for the input I(t). E: model schematic: the input I(t) is presented to our model neuron, which has both leak gleak and voltage-gated calcium gT conductances. The output directional bias DIout is computed by comparing the peak voltage deflections caused by both inputs and is then compared with the input directional bias DIin. F: output directional bias DIout as a function of input directional bias DIin for different values of the T-type calcium channel maximum conductance gT. G: illustration of 3 different regimes. 1) Both inputs cause voltage deflections that do not activate the T-type calcium conductance because their peak values are below its threshold for activation (dashed line). 2) The preferred input activates the T-type calcium conductance while the null input does not. 3) Both inputs activate the T-type calcium conductance. H: the response of the model to the all 3 inputs described in G. In case 1 (left): both inputs do not trigger a calcium spike and the model output thus has a similar directional bias than the input. The model thus acts like a “follower”. In case 2 (middle): the preferred input causes a calcium spike, which greatly increases the output directional bias for a given nonzero input directional bias. The model thus acts like an “amplifier.” In case 3 (right): both inputs cause calcium spikes that are similar in shape, thereby causing a decrease in the output directional bias. The model thus acts like an “attenuator.” For the simulations, we used An = 180, Ap = 310, gT = 0.3 μS.
FIG. 3
FIG. 3
Effects of varying the bias current Ibias, the T-type calcium channel conductance gT, and the input directional bias DIin on the output directional bias DIout. DIin was varied by increasing Ap while keeping An = 280. A: DIout as a function of changing both DIin and Ibias for gT = 0.3 μS. B: DIout as a function of changing both DIin and gT with Ibias = −1.1 nA. C: DIout as a function of changing both Ibias and gT for An = 280 and Ap = 310, which corresponds to DIin = 0.0968.
FIG. 4
FIG. 4
A mathematical model incorporating both short-term synaptic depression and a nonlinear T-type conductance can account for experimentally measured values of directional selectivity. A: |DSI| predicted by our model (y axis) with no active conductance (gT =0) compared with the actual |DSI| measured experimentally (x axis). Although there is a significant positive correlation between both quantities (R = 0.88, n = 18, P < 10−3), the predicted DSI underestimates the observed |DSI| in magnitude as most data points lie below the identity line (—). B: population-averaged DSI values predicted from the model with gT = 0 (grey) and measured experimentally (black) for neurons whose experimentally measured |DSI| < 0.15 (left), 0.15 ≤ |DSI| ≤ 0.5 (middle), and |DSI| > 0.5 (right). C: |DSI| predicted by our model with gT = 0.3 μS compared with the actual |DSI| measured experimentally. Both quantities are again strongly positively correlated (R = 0.92, n = 18, P < 10−3). However, this model can quantitatively account for the observed directional selectivity in the population of TS neurons as most data points are close to the identity line (—). D: population-averaged DSI values predicted from the model with gT = 0.3 μS (grey) and measured experimentally (black) for neurons whose experimentally measured |DSI| < 0.15 (left), 0.15 ≤ |DSI| ≤ 0.5 (middle), and |DSI| > 0.5 (right). E: mean square error 〈ε2〉 between the model and data as a function of gT. ns, the P value obtained using a sign-rank test was >0.05; *, the P value obtained using a sign-rank test was <0.01. Throughout, we used Ibias = − 1.1 nA for the model.
FIG. 5
FIG. 5
Subthreshold membrane conductances influence directional selectivity in TS individual neurons. A: example subthreshold membrane depolarization caused by a subthreshold membrane conductance that can be silenced by intracellular current injection. B: the amplitude of these membrane depolarizations as a function of the resting membrane potential that was varied by current injection for an example TS neuron. Note that the traces were low-pass filtered to remove sodium action potentials. C: |DSI| vs. current injection for an example TS neuron. D–F: average low-pass filtered membrane potential traces in response to a moving object for this same neuron at 3 different levels of polarization. G: population averaged values of |DSI| under control, hyperpolarized, and depolarized conditions. |DSI| values under both hyper- and depolarized conditions were significantly different from under control conditions (P = 0.0014, 1-wave ANOVA, n = 6). H: Δ|DSI| was defined as the value of |DSI| under current injection minus the value of |DSI| for no current injection and was significantly different from 0 (hyperpolarization: P = 0.00661, Wilcoxon sign-rank test, n = 6; depolarization: P = 0.00188, Wilcoxon sign-rank test, n = 6).
FIG. 6
FIG. 6
Subthreshold membrane conductances are preferentially elicited when the object moves in the preferred direction. A: 4 consecutive cycles of object motion (top) and corresponding recorded low-pass filtered (finite impulse response filter in spike2, 200 Hz cutoff frequency) membrane potential (bottom) from an example neuron. Current injection of −0.2 nA was used to maintain the membrane potential of this neuron at a value such that there is considerable trial-to-trial variability in the peak response in the preferred direction as marked by the plus signs. B: a histogram of the response amplitude for this same neuron in the preferred direction shows a bimodal distribution with a clear separation threshold (black vertical line). Trials that gave rise to a response amplitude in the preferred direction that was greater than the threshold were termed “active” and those that did not were termed “passive.” C: percentage of active trials as a function of the holding current for this same neuron. D: the low-pass filtered membrane potential waveforms are shown averaged over active (black) and passive (gray) trials for I = −0.2 nA. It is seen that the depolarization is greater in the preferred direction for active trials. However, both traces are similar in the null direction. E: population-averaged response amplitudes of depolarizations for active (black) and passive (grey) trials were not significantly different in the null direction (pairwise t-test, n = 7, P = 0.443) but were significantly higher for active trials in the preferred direction (pairwise t-test, n = 7, P = 0.004). The response amplitude was computed as the maximum value of the membrane potential minus its baseline value. F: the absolute directional bias |DSI| was significantly greater for active trials (black) as compared with passive trials (grey; P = 0.007, Wilcoxon rank sum test, n = 7).
FIG. 7
FIG. 7
Calcium-dependent channels enhance directional selectivity in TS neurons. A: averaged low-pass filtered (FIR filter in spike2, 30 Hz cutoff frequency) membrane potential response from an example neuron under control (black) and after injection of nickel chloride (NiCl2). A decreased peak voltage depolarization is observed in the preferred direction (right arrow) while no change is seen in the null direction (left arrow). B: both NiCl2 and mibefradil (Mib) reduced the amplitude of subthreshold depolarizations in TS neurons in the preferred direction. C: injection of both NiCl2 and Mib significantly reduced directional selectivity in TS neurons whereas saline injection had no effect. Asterisk, statistical significance using a Wilcoxon ranksum test at the P = 0.01 level; ns, no statistical significance. For NiCl2, we had P ≪ 10−3 and df = 24, whereas for Mib, we had P = 0.0024 and df = 26. For saline, we had P = 0.9697 and df = 19.
FIG. 8
FIG. 8
The sodium channel antagonist QX-314 does not affect directional selectivity in TS neurons. A: example membrane potential recording from a neuron’s baseline activity under control conditions (black) showing action potentials marked by asterisk. Note that the ~50 mV action potentials are truncated. The baseline activity from this same neuron did not show action potential firing in after application of QX-314 (gray). B: low-pass filtered (FIR filter in spike2, 30 Hz cutoff) membrane potential trace averaged over stimulus trials of this same neuron in response to a moving object under control (black) and after QX-314 (gray). Note that both traces almost completely overlap. C: population-averaged |DSI| values computed from the membrane potential under control and after QX-314 were not statistically significantly different from one another (P = 0.7334, sign-rank test, n = 12) as indicated (ns).
FIG. 9
FIG. 9
The chloride channel antagonist picrotoxin (PTX) does not affect directional selectivity in TS neurons. A: example membrane potential recording from a neuron’s baseline activity under control conditions (black). This same neuron showed elevated firing in its baseline activity as well as a greater propensity to fire bursts of action potentials (see asterisk) action potential firing after PTX (gray). B: low-pass filtered (FIR filter in spike2, 30 Hz cutoff) membrane potential trace of this same neuron in response averaged over stimulus trials to a moving object under control (black) and after PTX (gray). Note that both traces almost completely overlap. C: population-averaged |DSI| values computed from the membrane potential under control and after PTX injection were not statistically significantly different from one another (P = 0.5469, Wilcoxon rank-sum test, df = 15) as indicated (ns).
FIG. 10
FIG. 10
The N-methyl-D-aspartate receptor antagonist 2-amino-5-phosphonovaleric acid (APV) does not affect directional selectivity in TS neurons. A: example membrane potential recording from a neuron’s baseline activity under control conditions (black). This same neuron showed reduced baseline firing activity after APV (gray). B: low-pass filtered (FIR filter in spike2, 30 Hz cutoff) membrane potential trace of this same neuron averaged over stimulus trials in response to a moving object under control (black) and after APV (gray). Note that both traces almost completely overlap. C: population-averaged |DSI| values computed from the membrane potential under control and after APV injection were not statistically significantly different from one another (P = 0.4105, Wilcoxon rank-sum test, df = 18) as indicated (ns).

Similar articles

Cited by

References

    1. Adelson EH, Bergen JR. Spatiotemporal energy models for the perception of motion. J Opt Soc Am A Opt Image Sci. 1985;2:284–299. - PubMed
    1. Bao J, Li JJ, Perl E. Differences in Ca2+channels governing generation of miniature and evoked excitatory synaptic currents in spinal laminae I and II. J Neurosci. 1998;18:8740–8750. - PMC - PubMed
    1. Bastian J. Electrolocation. II. The effects of moving objects and other electrical stimuli on the activities of two categories of posterior lateral line lobe cells in Apteronotus albifrons. J Comp Physiol [A] 1981;144:481–494.
    1. Bastian J, Chacron MJ, Maler L. Receptive field organization determines pyramidal cell stimulus-encoding capability and spatial stimulus selectivity. J Neurosci. 2002;22:4577–4590. - PMC - PubMed
    1. Berman N, Dunn RJ, Maler L. Function of NMDA receptors and persistent sodium channels in a feedback pathway of the electrosensory system. J Neurophysiol. 2001;86:1612–1621. - PubMed

Publication types

MeSH terms

Grants and funding

LinkOut - more resources