

Cholinergic modulation of the resonance properties of stellate cells in layer II of medial entorhinal cortex
- PMID: 20445030
- PMCID: PMC2904208
- DOI: 10.1152/jn.00492.2009
Cholinergic modulation of the resonance properties of stellate cells in layer II of medial entorhinal cortex
Abstract
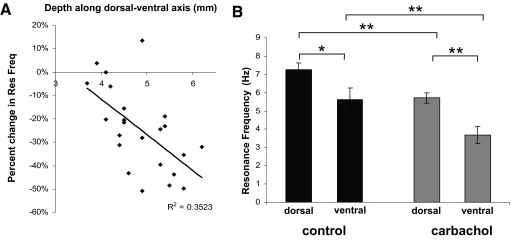
In vitro whole cell patch-clamp recordings of stellate cells in layer II of medial entorhinal cortex show a subthreshold membrane potential resonance in response to a sinusoidal current injection of varying frequency. Physiological recordings from awake behaving animals show that neurons in layer II medial entorhinal cortex, termed "grid cells," fire in a spatially selective manner such that each cell's multiple firing fields form a hexagonal grid. Both the spatial periodicity of the grid fields and the resonance frequency change systematically in neurons along the dorsal to ventral axis of medial entorhinal cortex. Previous work has also shown that grid field spacing and acetylcholine levels change as a function of the novelty to a particular environment. Using in vitro whole cell patch-clamp recordings, our study shows that both resonance frequency and resonance strength vary as a function of cholinergic modulation. Furthermore, our data suggest that these changes in resonance properties are mediated through modulation of h-current and m-current.
Figures


Similar articles
-
Neuromodulation of I(h) in layer II medial entorhinal cortex stellate cells: a voltage-clamp study.J Neurosci. 2012 Jun 27;32(26):9066-72. doi: 10.1523/JNEUROSCI.0868-12.2012. J Neurosci. 2012. PMID: 22745506 Free PMC article.
-
Physiological Properties of Neurons in Bat Entorhinal Cortex Exhibit an Inverse Gradient along the Dorsal-Ventral Axis Compared to Entorhinal Neurons in Rat.J Neurosci. 2016 Apr 20;36(16):4591-9. doi: 10.1523/JNEUROSCI.1791-15.2016. J Neurosci. 2016. PMID: 27098700 Free PMC article.
-
Knock-out of HCN1 subunit flattens dorsal-ventral frequency gradient of medial entorhinal neurons in adult mice.J Neurosci. 2009 Jun 10;29(23):7625-30. doi: 10.1523/JNEUROSCI.0609-09.2009. J Neurosci. 2009. PMID: 19515931 Free PMC article.
-
How to build a grid cell.Philos Trans R Soc Lond B Biol Sci. 2013 Dec 23;369(1635):20120520. doi: 10.1098/rstb.2012.0520. Print 2014 Feb 5. Philos Trans R Soc Lond B Biol Sci. 2013. PMID: 24366132 Free PMC article. Review.
-
Identified GnRH neuron electrophysiology: a decade of study.Brain Res. 2010 Dec 10;1364:10-24. doi: 10.1016/j.brainres.2010.09.066. Epub 2010 Nov 1. Brain Res. 2010. PMID: 20920482 Free PMC article. Review.
Cited by
-
Entorhinal stellate cells show preferred spike phase-locking to theta inputs that is enhanced by correlations in synaptic activity.J Neurosci. 2013 Apr 3;33(14):6027-40. doi: 10.1523/JNEUROSCI.3892-12.2013. J Neurosci. 2013. PMID: 23554484 Free PMC article.
-
Cholinergic modulation of the CAN current may adjust neural dynamics for active memory maintenance, spatial navigation and time-compressed replay.Front Neural Circuits. 2012 Mar 15;6:10. doi: 10.3389/fncir.2012.00010. eCollection 2012. Front Neural Circuits. 2012. PMID: 22435051 Free PMC article.
-
Membrane resonance enables stable and robust gamma oscillations.Cereb Cortex. 2014 Jan;24(1):119-42. doi: 10.1093/cercor/bhs293. Epub 2012 Oct 4. Cereb Cortex. 2014. PMID: 23042733 Free PMC article.
-
Neuronal rebound spiking, resonance frequency and theta cycle skipping may contribute to grid cell firing in medial entorhinal cortex.Philos Trans R Soc Lond B Biol Sci. 2013 Dec 23;369(1635):20120523. doi: 10.1098/rstb.2012.0523. Print 2014 Feb 5. Philos Trans R Soc Lond B Biol Sci. 2013. PMID: 24366135 Free PMC article.
-
Frequency of subthreshold oscillations at different membrane potential voltages in neurons at different anatomical positions on the dorsoventral axis in the rat medial entorhinal cortex.J Neurosci. 2011 Aug 31;31(35):12683-94. doi: 10.1523/JNEUROSCI.1654-11.2011. J Neurosci. 2011. PMID: 21880929 Free PMC article.
References
-
- Alonso AA, Klink R. Differential electroresponsiveness of stellate and pyramidal-like cells of medial entorhinal cortex layer II. J Neurophysiol 70: 128–143, 1993 - PubMed
-
- Alonso AA, Llinas RR. Subthreshold Na+-dependent theta-like rhythmicity in stellate cells of entorhinal cortex layer II. Nature 342: 175–177, 1989 - PubMed
-
- Barry C, Hayman R, Burgess N, Jeffery KJ. Experience-dependent rescaling of entorhinal grids. Nat Neurosci 10: 682–684, 2007 - PubMed
-
- Barry C, O'Keefe J, Burgess N. Effect of novelty on grid cell firing. Soc Neurosci Abstr 35: 101.24, 2009
Publication types
MeSH terms
Substances
Grants and funding
LinkOut - more resources
Full Text Sources