. 2010 Jul;104(1):4-17.
doi: 10.1152/jn.01098.2009. Epub 2010 May 5.

Taste-specific cell assemblies in a biologically informed model of the nucleus of the solitary tract

Affiliations

Taste-specific cell assemblies in a biologically informed model of the nucleus of the solitary tract

Andrew M Rosen et al. J Neurophysiol. 2010 Jul.

Abstract

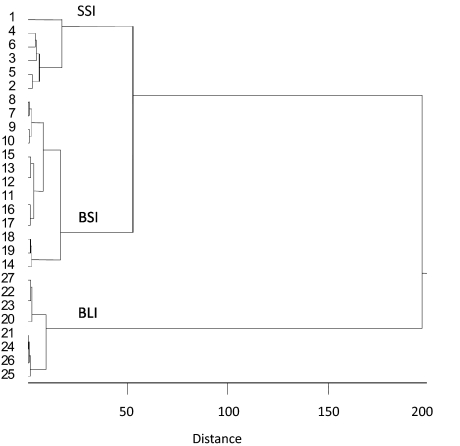
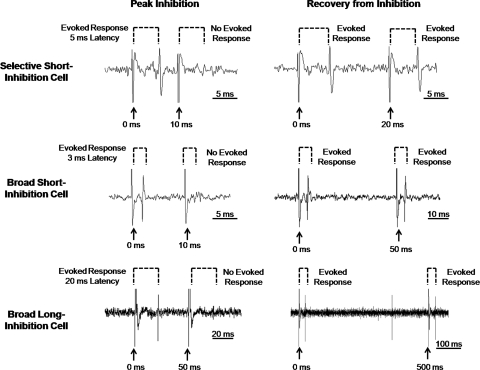
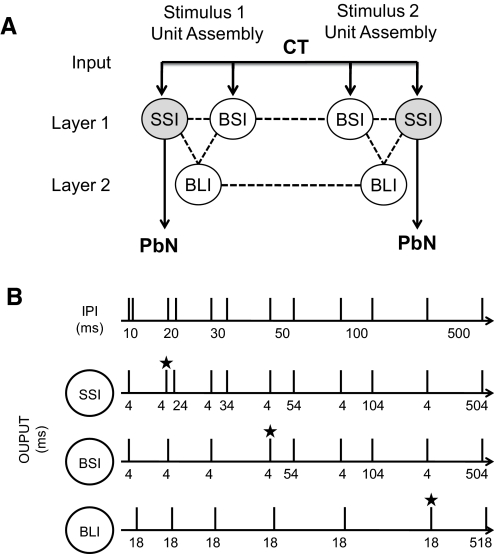
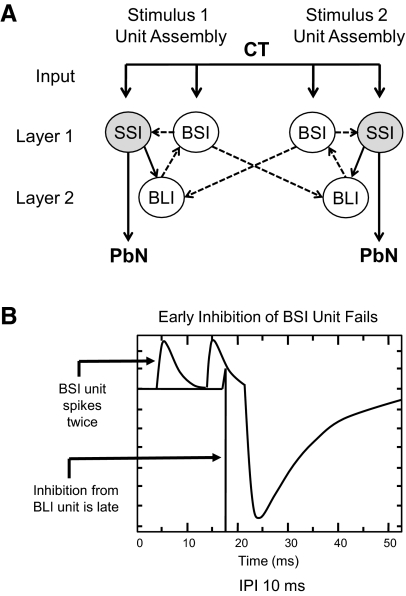
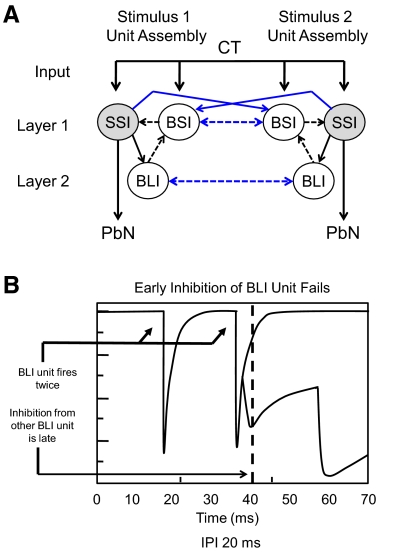
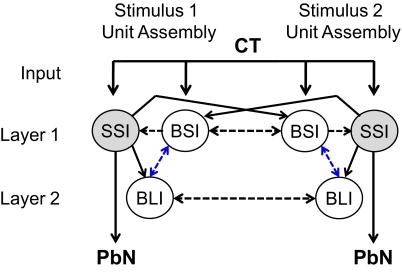
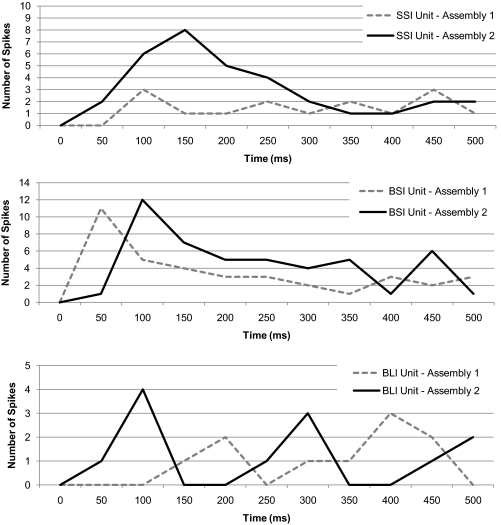
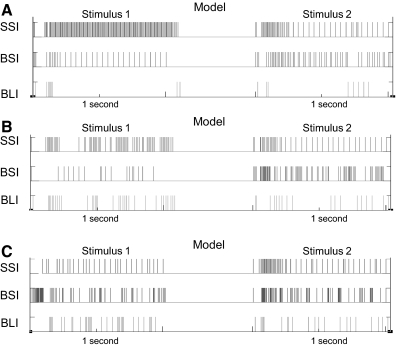
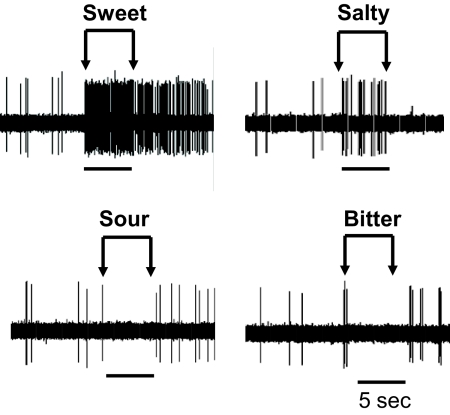
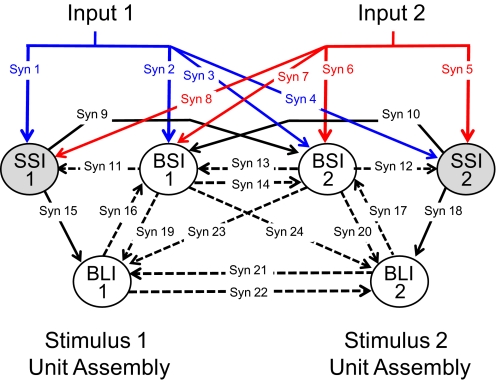
Although the cellular organization of many primary sensory nuclei has been well characterized, questions remain about the functional architecture of the first central relay for gustation, the rostral nucleus of the solitary tract (NTS). Here we used electrophysiological data recorded from single cells in the NTS to inform a network model of taste processing. Previous studies showed that electrical stimulation of the chorda tympani (CT) nerve initiates two types of inhibitory influences with different time courses in separate groups of NTS cells. Each type of inhibition targeted cells with distinct taste response properties. Further analyses of these data identified three NTS cell types differentiated by their latency of evoked response, time course of CT evoked inhibition, and degree of selectivity across taste qualities. Based on these results, we designed a model of the NTS consisting of discrete, reciprocally connected, stimulus-specific "cell" assemblies. Input to the network of integrate-and-fire model neurons was based on electrophysiological recordings from the CT nerve. Following successful simulation of paired-pulse CT stimulation, the network was tested for its ability to discriminate between two "taste" stimuli. Network dynamics of the model produced biologically plausible responses from each unit type and enhanced discrimination between taste qualities. We propose that an interactive network of taste quality specific cell assemblies, similar to our model, may account for the coherence in across-neuron patterns of NTS responses between similar tastants.


Figures

Fig. 1.
Fig. 1.
Results of a hierarchical cluster analysis of nucleus of the solitary tract (NTS) cells recorded in a previous investigation (Rosen and Di Lorenzo 2009). Latency of response to chorda tympani (CT) stimulation, time course of inhibition following paired-pulse stimulation of the CT nerve, and taste selectivity were used as variables. Similarity across cells was measured by the Pearson product-moment correlation. The Ward method of cluster formation was used. Cell numbers are indicated on the left. Three groups of cells were suggested by the analysis. See text for details. SSI, selective short-inhibition; BSI, broad short-inhibition; BLI, broad long-inhibition.
Fig. 2.
Fig. 2.
Examples of electrophysiological responses to paired-pulse stimulation of the CT nerve in each cell type suggested by the hierarchical cluster analysis. Left: records show failure of the evoked responses when the test pulse occurs during the interpulse interval that produces the most reliable inhibition of the evoked response. Right: records show a recovery from inhibition when the interpulse interval is longer than the period of inhibitory influence. Note the differences in scale for each record.
Fig. 3.
Fig. 3.
A: diagram of general model architecture. —, excitatory input and output; - - -, inter-unit connections. Layer 1 units receive direct excitatory input from the CT nerve while layer 2 units receive input from the selective short-inhibition units. The selective short-inhibition units are predicted to be relay units that project to the PbN while the broad short-inhibition and broad long-inhibition units are predicted to local interneurons. B: diagram of simulated paired-pulse input and optimal output of the network model. Top: the simulated paired-pulse stimulation at various interpulse intervals (IPIs). Numbers under the simulated “trace” indicate the particular IPI. The target output for each cell type was recovery from inhibition at a particular IPI. Rows 2–4: the simulated target responses of the model network in the SSI, BSI, and BLI units, respectively. Numbers under each simulated trace indicate the latency of “response” to the simulated stimulation shown in the 1st row. The SSI and BSI units showed a 4 ms response latency; the BLI unit showed an 18 ms response latency. ★, the IPI at which each pulse evokes a response, i.e., recovery from “inhibition.” Target output for the SSI, BSI, and BLI units was recovery from inhibition at IPIs 20, 50, and 500 ms, respectively.
Fig. 4.
Fig. 4.
A: model A: recurrent inhibitory network with feedforward inhibition. SSI and BSI units received input from the CT directly. BLI units received input through an excitatory projection from SSI units. In this initial configuration, the 2 assemblies were interconnected via feedforward inhibitory projections from BSI units to BLI units. —, excitatory connections; - - -, inhibitory connections. B: simulated output from a BSI (top) and a BLI (bottom) unit in model A following simulated paired-pulse stimulation at an interpulse interval of 10 ms. The BSI unit shows 2 spikes in response to the pair of input pulses indicating the lack of short term inhibition. At this IPI, the BSI unit should have spiked only once. This can be accounted for by the late arrival of inhibition from the BLI unit.
Fig. 5.
Fig. 5.
A: model B: recurrent inhibitory network with reciprocal lateral inhibition. The 2 assemblies were interconnected via reciprocal inhibitory lateral projections between BSI units and between BLI units, and lateral excitatory connections between the SSI units and the broad short-inhibition units of the opposite assembly. —, excitatory connections; - - -, inhibitory connections. Blue lines indicate connections that were different from those in model A. The lateral inhibitory connections between BSI units enabled the early inhibition (10 ms) of these cells. B: output from a BLI unit in model B following simulated paired-pulse stimulation at an IPI of 20 ms. At this IPI of stimulation, the BLI unit should have fired only once. However, the lateral inhibitory influence from the broad long-inhibition unit of the opposite assembly was delayed allowing the BLI unit to fire twice.
Fig. 6.
Fig. 6.
Model C: recurrent inhibitory network with lateral and feedforward inhibitory projections. The feedforward projections from broad short-inhibition units to broad long-inhibition units enabled the early inhibition (20 ms) of the broad long-inhibition units. —, excitatory connections; - - -, inhibitory connections. Blue lines indicate connections that were different from those in model B.
Fig. 7.
Fig. 7.
A: simulated taste responses of unit assembly 2 to presentation of stimulus 1 followed by stimulus 2 (both at 25 Hz). Stimulus 2 evoked a phasic-tonic pattern of response in the SSI unit that was not observed with presentation of stimulus 1. Both broadly tuned units responded nearly equally well to both stimuli 1 and 2. B: electrophysiological responses to a 5 s presentation of 2 different taste stimuli recorded from NTS neurons of each cell type. Similar to the network model, a phasic-tonic response pattern was apparent in the SSI neuron's response to its “best” stimulus (stimulus 2) and was absent with presentation of stimulus 1. Both broadly tuned units responded nearly equally well to both stimuli 1 and 2.
Fig. 8.
Fig. 8.
Time course of simulated responses in analogous cell types belonging to unit assemblies 1 and 2 responding to stimulus 2 (at 25 Hz). The responses of the SSI units to each stimulus were differentiated by spike count. The responses of the BSI and BLI units to each stimulus were differentiated by the timing of the peak firing rate. Note the differences in scale across graphs.
Fig. 9.
Fig. 9.
Simulated responses to stimuli 1 and 2 (both at 25 Hz) in each unit type from unit assembly 2 in models A–C. Data from model C are repeated from Fig. 7 for comparison with output from earlier models. See text for details.
Fig. 10.
Fig. 10.
Electrophysiological responses to taste stimuli recorded in a single NTS cell. Excitatory responses were observed with presentation of sweet (0.5 M sucrose) and salty (0.1 M NaCl) solutions while presentation of sour (0.01 M HCl) and bitter (0.01 M quinine HCl) solutions suppressed responsivity.
Fig. 11.
Fig. 11.
Diagram of the network model indicating the synapses that were modeled. Units are labeled according to type (SSI, BSI, or BLI) and unit assembly (1 or 2). —, excitatory connections; - - -, inhibitory connections. In each model, not all synapses were present.

Similar articles

Cited by

References

    1. Adachi M, Oshima T, Yamada S, Satoh T. Corss-correlation analysis of taste neuron pairs in rat solitary tract nucleus. J Neurophysiol 62: 501–509, 1989 - PubMed
    1. Arevian AC, Kapoor V, Urban NN. Activity-dependent gating of lateral inhibition in the mouse olfactory bulb. Nat Neurosci 11: 80–87, 2008 - PMC - PubMed
    1. Bradley RM. rNST circuits. In: The Role of the Nucleus of the Solitary Tract in Gustatory Processing, edited by Bradley RM. Boca Raton, FL: CRC, 2007 - PubMed
    1. Bradley RM, Grabauskas G. Neural circuits for taste. Excitation, inhibition, and synaptic plasticity in the rostral gustatory zone of the nucleus of the solitary tract. Ann NY Acad Sci 855: 467–474, 1998 - PubMed
    1. Bradley RM, Mistretta CM, Bates CA, Killackey HP. Transganglionic transport of HRP from the circumvallate papilla of the rat. Brain Res 361: 154–161, 1985 - PubMed

Publication types

LinkOut - more resources