

Neurodegeneration in a transgenic mouse model of multiple system atrophy is associated with altered expression of oligodendroglial-derived neurotrophic factors
- PMID: 20445049
- PMCID: PMC2896284
- DOI: 10.1523/JNEUROSCI.0567-10.2010
Neurodegeneration in a transgenic mouse model of multiple system atrophy is associated with altered expression of oligodendroglial-derived neurotrophic factors
Abstract
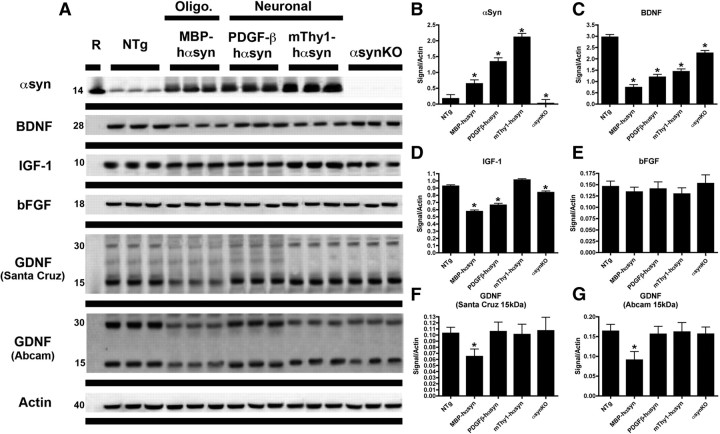
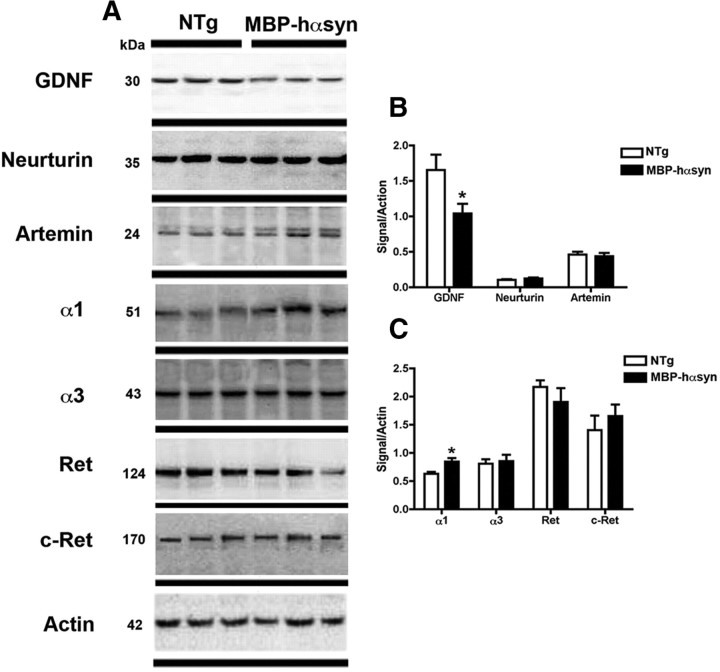
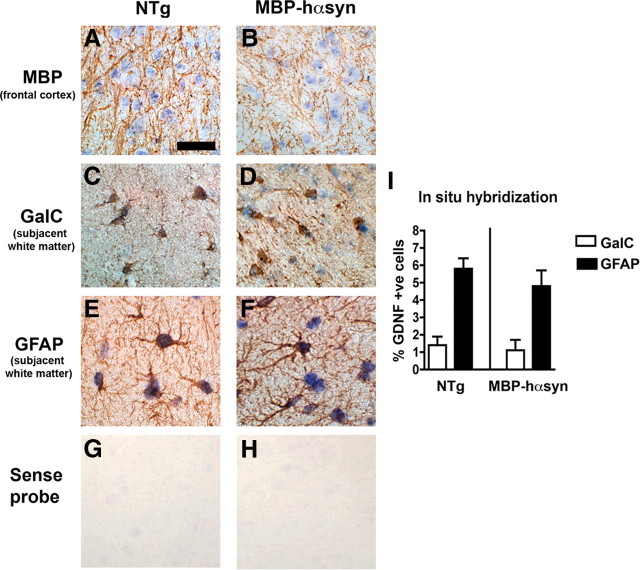
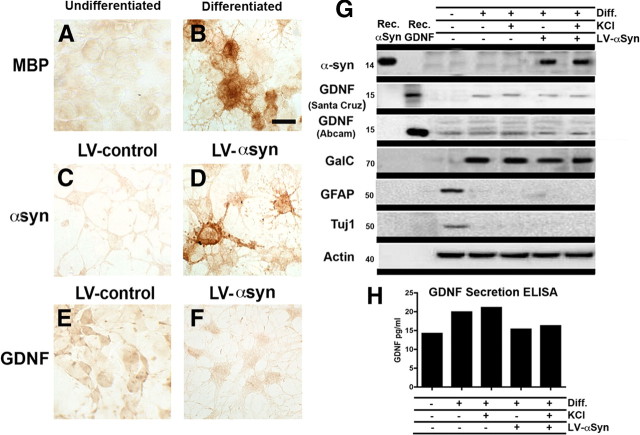
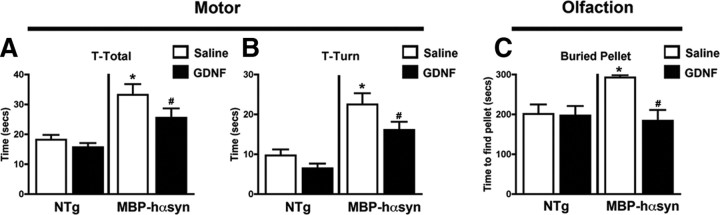
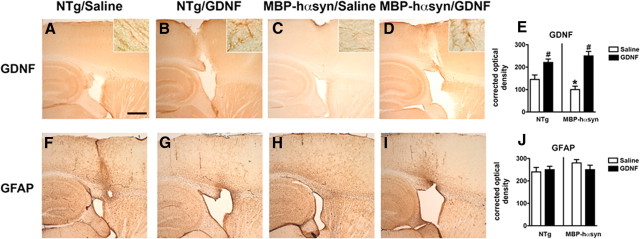
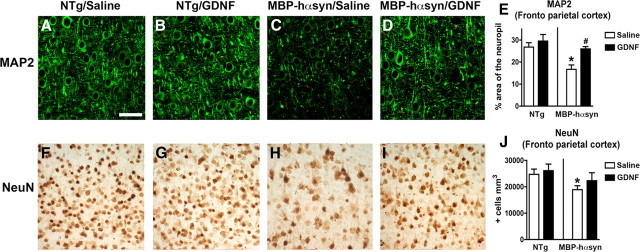
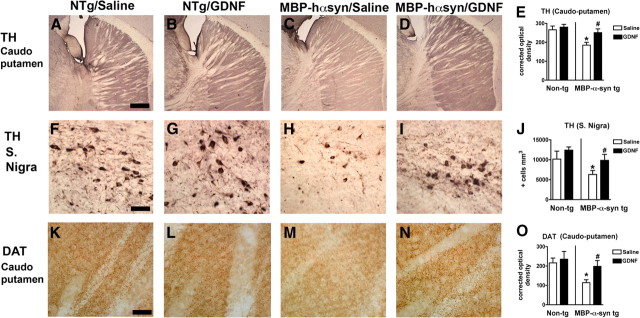
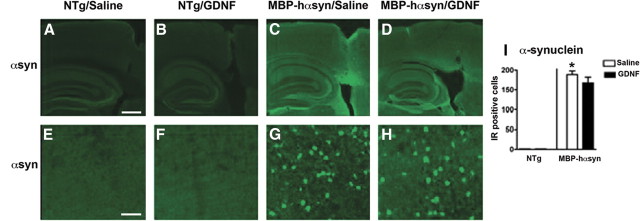
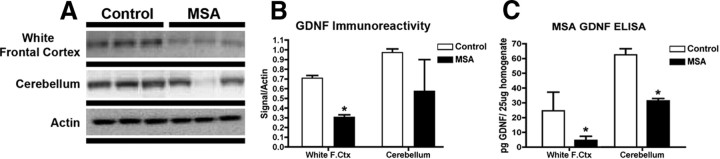
Multiple system atrophy (MSA) is a neurodegenerative disorder characterized by striatonigral degeneration and olivo-pontocerebellar atrophy. Neuronal degeneration is accompanied by primarily oligodendrocytic accumulation of alpha-synuclein (alphasyn) as opposed to the neuronal inclusions more commonly found in other alpha-synucleinopathies such as Parkinson's disease. It is unclear how alphasyn accumulation in oligodendrocytes may lead to the extensive neurodegeneration observed in MSA; we hypothesize that the altered expression of oligodendrocyte-derived neurotrophic factors by alphasyn may be involved. In this context, the expression of a number neurotrophic factors reportedly expressed by oligodendrocytes [glial-derived neurotrophic factor (GDNF), brain-derived neurotrophic factor (BDNF), and insulin-like growth factor 1 (IGF-1), as well as basic fibroblast growth factor 2 (bFGF2), reportedly astrocyte derived] were examined in transgenic mouse models expressing human alphasyn (halphasyn) under the control of either neuronal (PDGFbeta or mThy1) or oligodendrocytic (MBP) promoters. Although protein levels of BDNF and IGF-1 were altered in all the alphasyn transgenic mice regardless of promoter type, a specific decrease in GDNF protein expression was observed in the MBP-halphasyn transgenic mice. Intracerebroventricular infusion of GDNF improved behavioral deficits and ameliorated neurodegenerative pathology in the MBP-halphasyn transgenic mice. Consistent with the studies in the MBP-halphasyn transgenic mice, analysis of GDNF expression levels in human MSA samples demonstrated a decrease in the white frontal cortex and to a lesser degree in the cerebellum compared with controls. These results suggest a mechanism in which alphasyn expression in oligodendrocytes impacts on the trophic support provided by these cells for neurons, perhaps contributing to neurodegeneration.
Figures
Similar articles
-
Fluoxetine ameliorates behavioral and neuropathological deficits in a transgenic model mouse of α-synucleinopathy.Exp Neurol. 2012 Apr;234(2):405-16. doi: 10.1016/j.expneurol.2012.01.008. Epub 2012 Jan 16. Exp Neurol. 2012. PMID: 22281106 Free PMC article.
-
Mitochondrial inhibitor 3-nitroproprionic acid enhances oxidative modification of alpha-synuclein in a transgenic mouse model of multiple system atrophy.J Neurosci Res. 2009 Sep;87(12):2728-39. doi: 10.1002/jnr.22089. J Neurosci Res. 2009. PMID: 19405128 Free PMC article.
-
FTY720-Mitoxy reduces synucleinopathy and neuroinflammation, restores behavior and mitochondria function, and increases GDNF expression in Multiple System Atrophy mouse models.Exp Neurol. 2020 Mar;325:113120. doi: 10.1016/j.expneurol.2019.113120. Epub 2019 Nov 18. Exp Neurol. 2020. PMID: 31751571 Free PMC article.
-
Is Multiple System Atrophy a Prion-like Disorder?Int J Mol Sci. 2021 Sep 18;22(18):10093. doi: 10.3390/ijms221810093. Int J Mol Sci. 2021. PMID: 34576255 Free PMC article. Review.
-
Cellular pathology in multiple system atrophy.Neuropathology. 2006 Aug;26(4):338-45. doi: 10.1111/j.1440-1789.2006.00713.x. Neuropathology. 2006. PMID: 16961071 Review.
Cited by
-
Cross-examining candidate genes implicated in multiple system atrophy.Acta Neuropathol Commun. 2019 Jul 24;7(1):117. doi: 10.1186/s40478-019-0769-4. Acta Neuropathol Commun. 2019. PMID: 31340844 Free PMC article. Review.
-
Effects of single and combined immunotherapy approach targeting amyloid β protein and α-synuclein in a dementia with Lewy bodies-like model.Alzheimers Dement. 2019 Sep;15(9):1133-1148. doi: 10.1016/j.jalz.2019.02.002. Epub 2019 Aug 1. Alzheimers Dement. 2019. PMID: 31378574 Free PMC article.
-
Preserved functional autonomic phenotype in adult mice overexpressing moderate levels of human alpha-synuclein in oligodendrocytes.Physiol Rep. 2014 Nov 26;2(11):e12209. doi: 10.14814/phy2.12209. Print 2014 Nov 1. Physiol Rep. 2014. PMID: 25428949 Free PMC article.
-
Novel Therapies for Parkinsonian Syndromes-Recent Progress and Future Perspectives.Front Mol Neurosci. 2021 Aug 26;14:720220. doi: 10.3389/fnmol.2021.720220. eCollection 2021. Front Mol Neurosci. 2021. PMID: 34512258 Free PMC article. Review.
-
Multiple system atrophy: a clinical and neuropathological perspective.Trends Neurosci. 2011 Nov;34(11):581-90. doi: 10.1016/j.tins.2011.08.003. Epub 2011 Sep 29. Trends Neurosci. 2011. PMID: 21962754 Free PMC article. Review.
References
-
- Abele M, Riet A, Hummel T, Klockgether T, Wüllner U. Olfactory dysfunction in cerebellar ataxia and multiple system atrophy. J Neurol. 2003;250:1453–1455. - PubMed
-
- Aleman A, Torres-Alemán I. Circulating insulin-like growth factor I and cognitive function: neuromodulation throughout the lifespan. Prog Neurobiol. 2009;89:256–265. - PubMed
-
- Arenas E, Trupp M, Akerud P, Ibáñez CF. GDNF prevents degeneration and promotes the phenotype of brain noradrenergic neurons in vivo. Neuron. 1995;15:1465–1473. - PubMed
-
- Arima K, Uéda K, Sunohara N, Arakawa K, Hirai S, Nakamura M, Tonozuka-Uehara H, Kawai M. NACP/alpha-synuclein immunoreactivity in fibrillary components of neuronal and oligodendroglial cytoplasmic inclusions in the pontine nuclei in multiple system atrophy. Acta Neuropathol. 1998;96:439–444. - PubMed
-
- Armstrong RA, Cairns NJ, Lantos PL. A quantitative study of the pathological changes in white matter in multiple system atrophy. Neuropathology. 2007;27:221–227. - PubMed
Publication types
MeSH terms
Substances
Grants and funding
LinkOut - more resources
Full Text Sources
Other Literature Sources
Miscellaneous