. 2010 May 5;30(18):6302-14.
doi: 10.1523/JNEUROSCI.5482-09.2010.

Mammalian target of rapamycin signaling modulates photic entrainment of the suprachiasmatic circadian clock

Affiliations

Mammalian target of rapamycin signaling modulates photic entrainment of the suprachiasmatic circadian clock

Ruifeng Cao et al. J Neurosci. .

Abstract

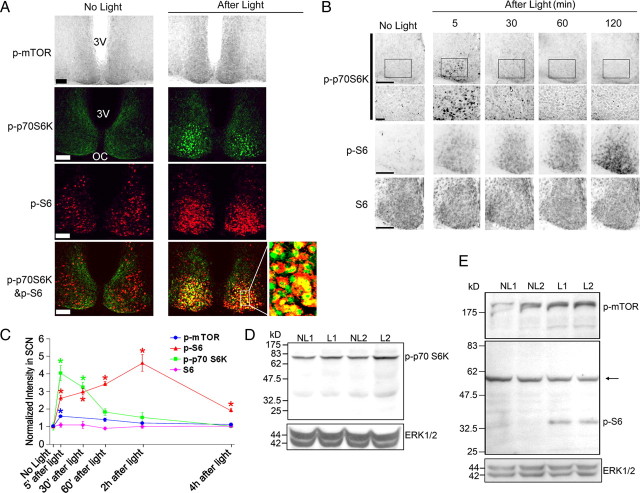
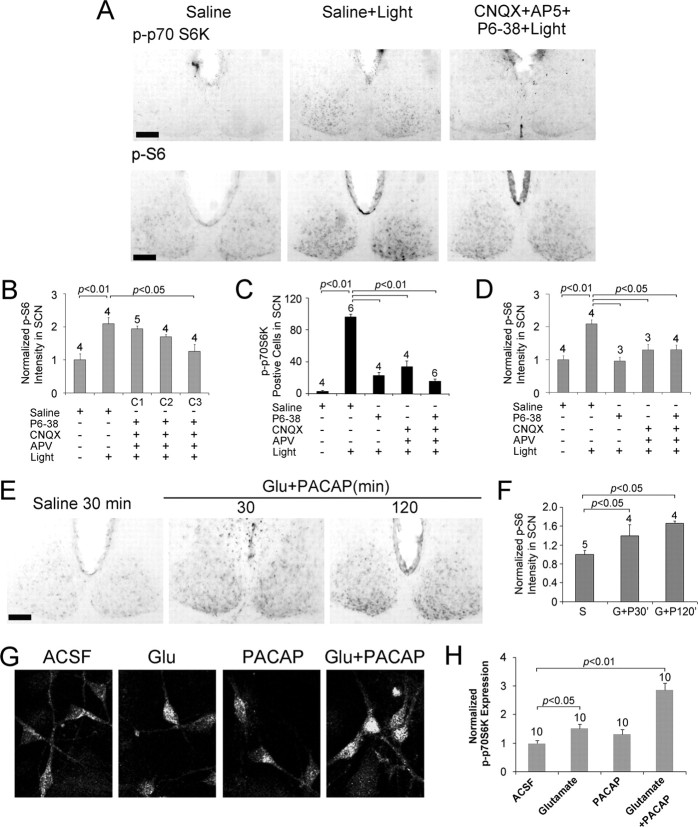
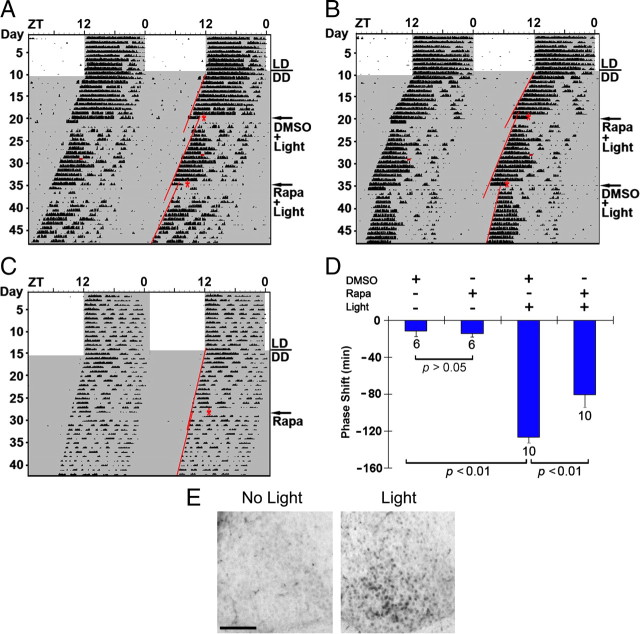
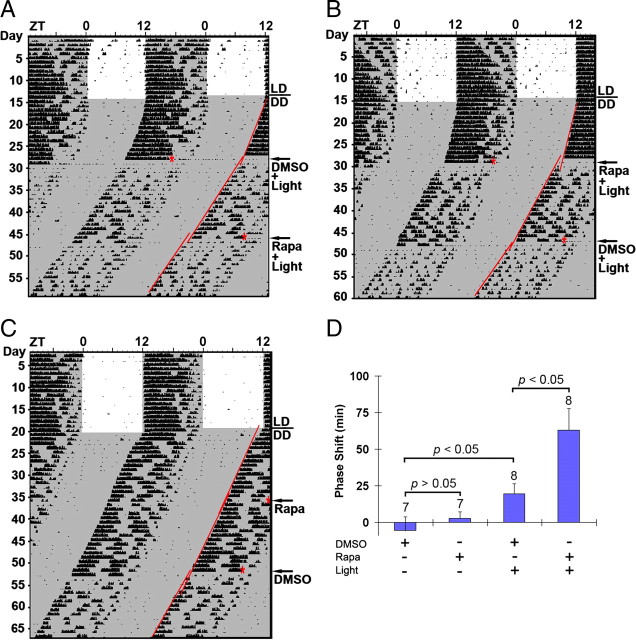
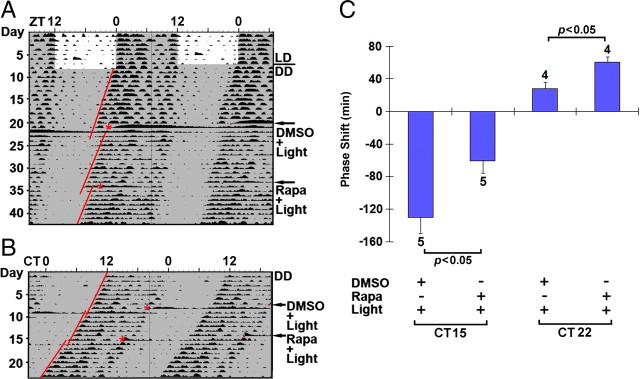
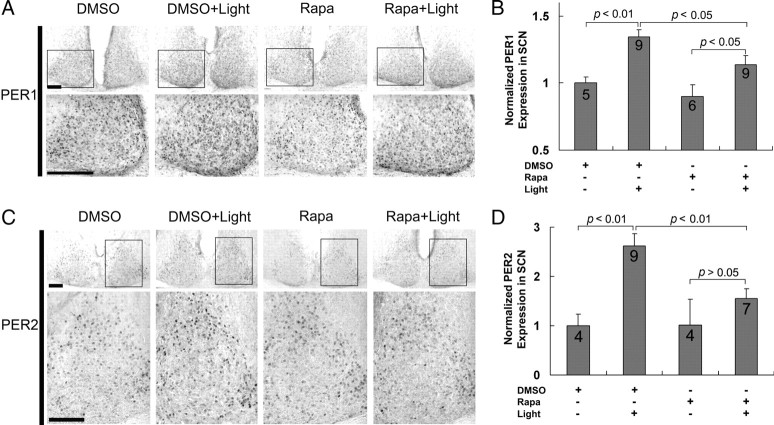
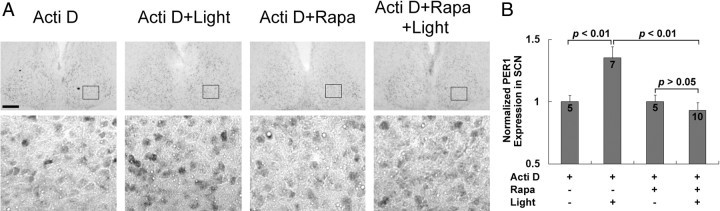
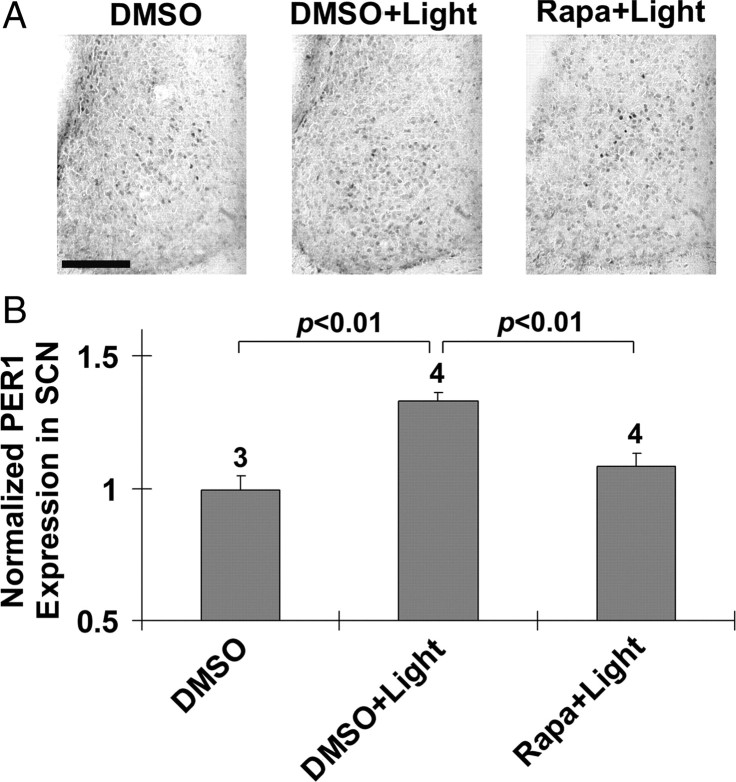
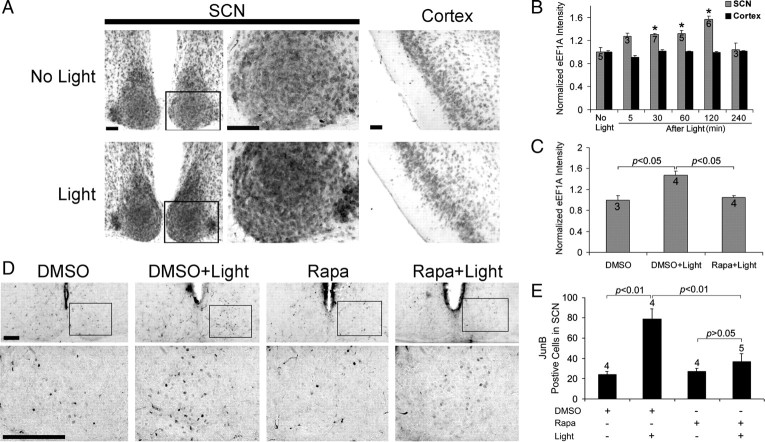
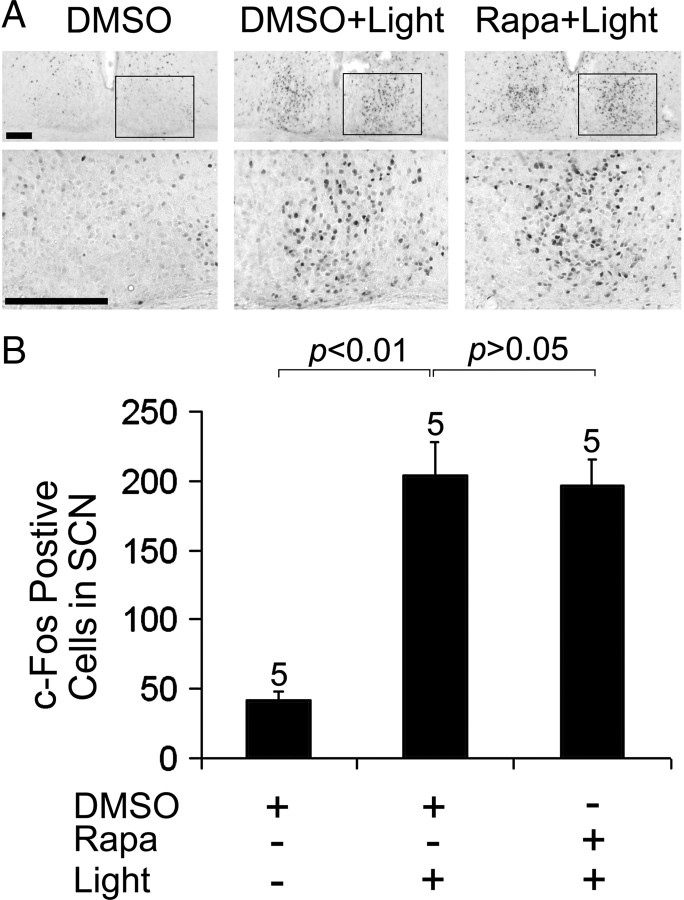
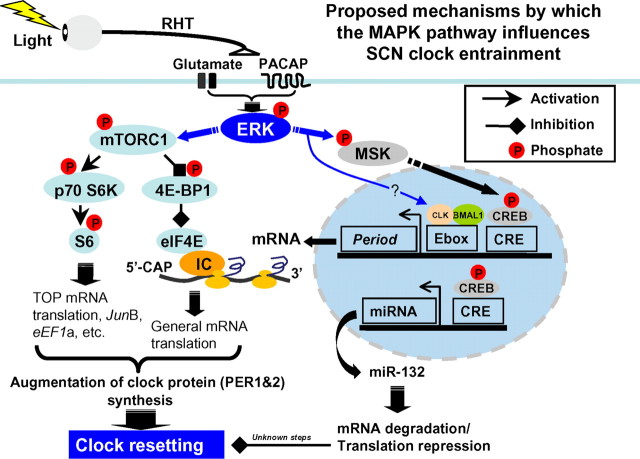
Inducible gene expression appears to be an essential event that couples light to entrainment of the master mammalian circadian clock located in the suprachiasmatic nucleus (SCN) of the hypothalamus. Recently, we reported that light triggers phase-dependent activation of the mammalian target of rapamycin (mTOR) signaling pathway, a major regulator of protein synthesis, in the SCN, thus raising the possibility that mTOR-evoked mRNA translation contributes to clock entrainment. Here, we used a combination of cellular, molecular, and behavioral assays to address this question. To this end, we show that the in vivo infusion of the mTOR inhibitor rapamycin led to a significant attenuation of the phase-delaying effect of early-night light. Conversely, disruption of mTOR during the late night augmented the phase-advancing effect of light. To assess the role of mTOR signaling within the context of molecular entrainment, the effects of rapamycin on light-induced expression of PERIOD1 and PERIOD2 were examined. At both the early- and late-night time points, abrogation of mTOR signaling led to a significant attenuation of light-evoked PERIOD protein expression. Our results also reveal that light-induced mTOR activation leads to the translation of mRNAs with a 5'-terminal oligopyrimidine tract such as eukaryotic elongation factor 1A and the immediate early gene JunB. Together, these data indicate that the mTOR pathway functions as potent and selective regulator of light-evoked protein translation and SCN clock entrainment.


Figures

Figure 1.
Figure 1.
Light-induced mTOR activation in the SCN. A, Top, Representative micrographs of tissue labeled for the Thr-2448-phosphorylated form of mTOR. Relative to the control condition (No Light), photic stimulation (400 lux, 15 min, CT15) triggered an increase in mTOR phosphorylation. Mice were killed 5 min after cessation of the light pulse. Middle, Representative confocal images of SCN tissue double labeled for the expression of Thr-389-phosphorylated p70 S6K (p-p70 S6K; green) and Ser-240/244 phosphorylated S6 (p-S6; red). Relative to the control condition (No Light), light triggered a marked increase in the phosphorylated forms of both proteins. Bottom, Merging of the two signals revealed cellular colocalization of the two antigens. The framed area is magnified to the right. 3V, Third ventricle; OC, optic chiasm. Scale bars, 100 μm. B, Top, Middle rows, Temporal profile of light-induced p70 S6K and S6 phosphorylation. Mice were killed at the noted times after light exposure (400 lux, 15 min) at CT15. Control mice (No Light) were killed at CT15. Bottom, Immunohistochemical profile of total S6 expression after light exposure. Scale bars, 100 μm. C, Quantification of light-induced p-mTOR, p-p70 S6K, p-S6, and S6 expression. *p < 0.05 compared to the “no light” control value, which was normalized to a value of 1. Data were collected from four or five animals for each group. D, E, Control and light-pulsed animals (CT15, 400 lux, 15 min) were killed at CT15.25, and SCN tissue was examined via Western blot analysis. Probing with a p-p70 S6K antibody (D) revealed that light treatment (L1 and L2; biological replicates) stimulated an increase in the phosphorylation of an ∼70 kDa band relative to the control “no light” condition (NL1, NL2; biological replicates). Relative to the “no light” condition, an increase in p-mTOR and pS6 expression (E) was also detected. The molecular weights of these bands are consistent with the sizes of mTOR (∼289 kDa) and S6 (∼32 kDa). The arrow indicates a nonspecific band. As loading controls, blots were probed for total ERK expression.
Figure 2.
Figure 2.
Glutamatergic and PACAPergic neurotransmission couples light to mTOR activation in the SCN. A, Representative immunohistochemical labeling for control (Saline) and light-evoked (400 lux, 15 min, CT15) p-p70S6K and p-S6 after infusion of physiological saline (Saline+Light) or a mixture of CNQX (2.5 mm), AP5 (25 mm), and PACAP 6-38 (P6-38, 1 mm; CNQX+AP5+P6–38+Light). Compared to the Saline+Light condition (middle), the infusion of PACAP and glutamate receptor antagonists led to an attenuation of p70S6K and S6 phosphorylation (right). Scale bars, 100 μm. B, Quantitative analysis of p-S6 expression under three dosages of the inhibitor cocktail. C1, CNQX (150 μm), AP5 (1.6 mm) and PACAP 6-38 (60 μm) plus light; C2, CNQX (600 μm), AP5 (6 mm), and PACAP 6-38 (240 μm) plus light; C3, CNQX (2.5 mm), AP5 (25 mm), and PACAP 6-38 (1 mm) plus light. The light-stimulus paradigm is described in A. C, D, Quantitative analysis of p-p70S6K (C) and p-S6 (D) expression under the five treatment conditions indicated below each panel. Mice were infused with PACAP 6-38 (P6-38, 1 mm) and/or CNQX (2.5 mm) and AP5 (25 mm) at CT14.5. The light-stimulus paradigm is described in A. E, Representative immunohistochemical labeling for p-S6 after the ventricular infusion of saline or PACAP (200 μm) and glutamate (2.5 mm) at CT14.5. Animals were killed 30 or 120 min after infusion. Under the control condition, low p-S6 levels were detected in the SCN. PACAP and glutamate infusion increased S6 phosphorylation. Scale bar, 100 μm. F, Histogram quantifying p-S6 under the three conditions outlined in D. S, Saline; G+P30′, killed 30 min after glutamate and PACAP infusion; G+P120′, killed 120 min after glutamate and PACAP infusion. G, Representative confocal images of p70 S6K phosphorylation in cultured SCN neurons. Cultures were stimulated (30 min) with glutamate (10 μm), PACAP (200 nm), or glutamate and PACAP (10 μm and 200 nm, respectively) and then fixed and immunolabled. Relative to mock stimulation (ACSF), glutamate or PACAP alone induced a moderate increase in p-p70 S6K expression. However, the coadministration of glutamate and PACAP induced robust p70 S6K activation. H, Quantitative analysis of p-70S6K expression in SCN neurons under the conditions described in G. For all histograms, data were normalized to the saline (or ACSF) condition, which was set to a value of 1. Please see Materials and Methods for a detailed description of the quantitation methods.
Figure 3.
Figure 3.
Disruption of mTOR signaling attenuates light-induced phase delaying of circadian locomotor activity. A, B, Representative double-plotted actographs of wheel-running activity. Initially, mice were entrained on a 12 h LD cycle and then transferred to total darkness. After ∼10 d under DD, mice were infused with DMSO vehicle (A) or the mTOR inhibitor rapamycin (100 μm; B) 30 min before light exposure (100 lux, 15 min) at CT15 (red asterisks). Animals free ran for 14 d and then received a second infusion of rapamycin (A) or DMSO (B) followed by light treatment. Regression lines approximate the phase-delaying effects of light. The small horizontal red bars in the activity records denote an “off-line” period when wheel-running activity was not recorded. C, Representative actograph shows that rapamycin (100 μm) infusion at CT15 did not markedly affect clock timing or phasing. D, Statistical representation of the early-night phase-shifting data. Of note, the light-evoked phase delay was significantly attenuated by rapamycin. Numbers above the bars denote the number of animals examined for each condition. E, Light-evoked p70 S6K phosphorylation. To test whether the light intensity (100 lux, 15 min) used in the behavioral experiments evokes mTOR activation, mice were exposed to light (100 lux, 15 min) at CT22 and killed immediately thereafter. Immunohistochemical labeling revealed a light-evoked increase in p-p70 S6K, relative to control mice (no light). Scale bar, 100 μm.
Figure 4.
Figure 4.
mTOR functions as a negative regulator of late-night light-evoked phase advancing of the circadian clock. A, B, Representative double-plotted actographs of wheel-running activity. Mice were dark adapted and infused with DMSO vehicle (A) or rapamycin (100 μm; B) 30 min before light (100 lux, 15 min) exposure at CT22 (red asterisks). Mice were allowed to free run under DD for 19 d, and then they received a second infusion of rapamycin (A) or DMSO (B) followed by light exposure. Regression lines approximate the light-evoked phase shifts. C, A representative actograph shows that rapamycin infusion at CT22 did not markedly affect clock timing or phasing. D, Statistical analysis of late-night phase shifting. Of interest, the phase-advancing effect of light was significantly enhanced by rapamycin infusion. Numbers above the bars denote the number of animals analyzed for each condition.
Figure 5.
Figure 5.
Disruption of mTOR signaling attenuates light-induced phase delaying but enhances light-induced phase advancing of the circadian core body temperature rhythm. A, B, Representative double-plotted actographs of core body temperature recordings. Initially, cannulated mice were entrained on a 12 h LD cycle and then transferred to total darkness. After ∼10 d under DD, mice were infused with DMSO vehicle or the mTOR inhibitor rapamycin (Rapa; 100 μm) 30 min before light exposure (100 lux, 15 min) at CT15 (A) or CT22 (red asterisks) (B). Animals free ran for 7–14 d and then received a second infusion of rapamycin or DMSO followed by light treatment. Regression lines approximate the phase-delaying (A) or phase-advancing (B) effect of light. C, Statistical representation of the early-night (CT15) and late-night (CT22) data sets. Of note, the light-evoked phase delay was significantly attenuated by rapamycin. However, the light-evoked phase advance was significantly enhanced by rapamycin. Numbers above the bars denote the number of animals examined for each condition.
Figure 6.
Figure 6.
mTOR facilitates early-night light-induced PER1 and PER2 expression in the SCN. A, C, Representative immunohistochemical labeling for PER1 (A) and PER2 (C) protein expression in the SCN. Cannulated mice were dark adapted for 2 d and then infused (CT14.5) with rapamycin (100 μm) or DMSO vehicle and exposed to light (400 lux, 15 min) at CT15. After light exposure, animals were returned to darkness for 4 h and then killed at CT19. In addition, two “no light” control groups were infused with DMSO or rapamycin at CT14.5 and killed at CT19. Immunolabeling revealed that light (DMSO+Light) evoked an increase in PER1 and PER2 expression relative to the control condition (DMSO). PER1 induction was mainly located in the ventral SCN (A), whereas the increase in PER2 expression was predominantly located in the lateral and dorsal regions of the SCN (C). For each representative section, the boxed area is magnified and shown below. Scale bars, 100 μm. B, D, Quantification of light-induced PER1 (B) and PER2 (D) expression in the SCN. Of note, the light-induced increase in PER1 and PER2 expression was significantly attenuated by rapamycin. Under basal conditions, rapamycin led to a modest but statistically insignificant decrease in PER1 and PER2 protein expression. Numbers in the bars denote the number of animals analyzed for each condition. PER1 and PER2 expression data were normalized to the DMSO infusion condition, which was set to a value of 1.
Figure 7.
Figure 7.
mTOR facilitates light-induced PER1 expression in the SCN in the presence of actinomycin D. A, Cannulated mice were dark adapted for 2 d and then infused (CT14.5) with actinomycin D (Acti D; 2 μg/μl, 1 μl) and rapamycin (Rapa; 100 μm, 2 μl) or DMSO vehicle and exposed to light (400 lux, 15 min) at CT15. After light exposure, animals were returned to darkness for 4 h and then killed (CT19). In addition, two “no light” control groups were infused with actinomycin D and DMSO or rapamycin at CT14.5 and killed at CT19. Immunolabeling revealed that in the presence of actinomycin D, light (Acti D+Light) evoked a moderate increase of PER1 expression relative to the control condition (Acti D). Infusion of rapamycin attenuated the light-evoked increase (Acti D+Rapa+Light) in PER1 expression. For each representative section, the boxed area is magnified and shown below. Scale bars, 100 μm. B, Quantification of the data set depicted in A. Of note, the light-evoked, actinomycin D-insensitive increase in PER1 expression was significantly attenuated by rapamycin. Numbers on the bars denote the number of animals analyzed for each condition. The PER1 expression data were normalized to the actinomycin/no light infusion condition, which was set to a value of 1. See Materials and Methods for a detailed description of the quantitation methods.
Figure 8.
Figure 8.
mTOR facilitates late-night light-induced PER1 expression in the SCN. A, Representative immunohistochemical labeling for PER1 protein expression. Cannulated animals were dark adapted for 2 d and then infused at CT19.5 with rapamycin (100 μm) or DMSO vehicle. Mice were exposed to light (400 lux, 15 min) at CT20, returned to darkness, and killed 6 h later (CT2). Control mice were infused with DMSO as described above, and killed at CT2. Immunolabeling revealed that light induced a moderate increase in PER1 expression in the SCN (DMSO+Light vs DMSO). The light-evoked increase in PER1 was attenuated by rapamycin infusion (Rapa+Light). The presentation of high-magnification images of a single SCN was necessitated by the relatively modest light-evoked PER1 induction pattern. Scale bar, 100 μm. B, Quantification of PER1 expression. Numbers above the bars denote the number of animals analyzed for each condition. PER1 expression data were normalized to the DMSO infusion condition, which was set to a value of 1. See Materials and Methods for a detailed description of the quantitation methods.
Figure 9.
Figure 9.
Light induces mTOR-dependent eEF1A and JunB expression in the SCN. A, Representative immunohistochemical images of eEF1A expression in the SCN. Mice were dark adapted for 2 d and then exposed to light (400 lux, 15 min) at CT15. Animals were killed at CT17. Control animals (No Light) were also killed at CT17. Relative to control animals, light exposure triggered a moderate increase in eEF1A expression in the SCN; the boxed regions of the SCN are magnified and shown to the right. In contrast to the SCN, light did not affect eEF1A expression in the piriform cortex (Cortex). Scale bars: Low magnification, 100 μm; high magnification, 50 μm. B, Quantification of light-induced eEF1A expression in the SCN and piriform cortex (Cortex). Animals were killed 5, 30, 60, 120, and 240 min after light exposure at CT15. Control animals (No Light) were killed at CT15. The eEF1A expression in the SCN increased as a function of time after light exposure (up to 2 h after light). Numbers on the bars denote the number of animals analyzed for each condition. *p < 0.05 versus the “no light” control. eEF1A expression data were normalized to the no light conditions, which were set to a value of 1. C, Rapamycin infusion abolished light-induced eEF1A expression in the SCN. Rapamycin (100 μm) was infused 30 min before light treatment at CT15. Animals were killed 2 h after light exposure. Data are presented as described in B. D, Representative immunohistochemical labeling for JunB protein expression in the SCN. Mice were dark adapted for 2 d and then infused with rapamycin (100 μm) or DMSO vehicle 30 min before light (400 lux, 15 min) exposure at CT15. Animals were killed 0–10 min after termination of the light stimulus. Immunolabeling revealed that the light-induced increase in JunB expression (DMSO+Light) was attenuated by rapamycin (Rapa+Light). Scale bars, 100 μm. E, Quantification of light-induced JunB expression. Numbers above the bars denote the number of animals analyzed for each condition. See Materials and Methods for a detailed presentation of the cell-counting method.
Figure 10.
Figure 10.
mTOR does not regulate light-induced c-Fos expression in the SCN. A, Representative immunohistochemical labeling for c-Fos protein. Mice were dark-adapted for 2 d and then infused with rapamycin (100 μm) or DMSO vehicle 30 min before light (400 lux, 15 min) at CT15. Animals were killed 0–10 min after termination of the light stimulus. The robust light-evoked increase in c-Fos expression (DMSO+Light) was not affected by rapamycin treatment (Rapa+Light). Framed areas of the SCN are magnified and shown below. Scale bars, 100 μm. B, Quantification of c-Fos protein expression in the SCN. Numbers above the bars denote the number of animals analyzed for each condition. See Materials and Methods for a detailed presentation of the cell-counting method.
Figure 11.
Figure 11.
Schematic overview of MAPK-regulated processes that are thought to couple light to the SCN clock during the early night. Photic input from the RHT drives the release of the excitatory amino acid glutamate and the neuropeptide PACAP. Postsynaptic receptors trigger actuation of the MAPK signaling cassette, ultimately leading to the phosphoactivation of the effector kinase ERK. Two principal ERK-mediated signaling events are depicted: activation of MSK and the mTORC1 signaling complex. A potential signaling pathway from ERK to CLOCK (CLK) is also depicted (Weber et al., 2006). Signaling through MSK leads to activation of transcription factors such as CREB (Vermeulen et al., 2009), which in turn drives the induction of early response genes, including c-fos and the clock gene Period1, and potentially Period2 (Travnickova-Bendova et al., 2002). CREB also stimulates the expression of the microRNA miR-132, which works through an as yet unidentified mechanism to limit the resetting effects of light (Cheng et al., 2007). ERK-dependent activation of mTORC1 causes phosphorylation-dependent activation of a p70 S6K/S6 signaling cassette, which stimulates TOP mRNA translation, and a 4E-BP1 and eEF1A signaling cassette, which increases CAP-dependent translation. These two arms of the mTOR pathway work in conjunction to enhance the rate of mRNA processivity. With respect to clock entrainment, we posit that the ERK-dependent transcription (via MSK/CREB) and ERK-dependent translation facilitation (via the mTOR pathway) lead to a robust induction of the PERIOD protein expression. As a state variable of the clock (Reppert and Weaver, 2002), the induction of PERIOD leads to a rapid resetting of the molecular oscillator.

Similar articles

Cited by

References

    1. Adams J, Sweatt JD. Molecular psychology: roles for the ERK MAP kinase cascade in memory. Annu Rev Pharmacol Toxicol. 2002;42:135–163. - PubMed
    1. Akiyama M, Kouzu Y, Takahashi S, Wakamatsu H, Moriya T, Maetani M, Watanabe S, Tei H, Sakaki Y, Shibata S. Inhibition of light- or glutamate-induced mPer1 expression represses the phase shifts into the mouse circadian locomotor and suprachiasmatic firing rhythms. J Neurosci. 1999;19:1115–1121. - PMC - PubMed
    1. Albrecht U, Sun ZS, Eichele G, Lee CC. A differential response of two putative mammalian circadian regulators, mper1 and mper2, to light. Cell. 1997;91:1055–1064. - PubMed
    1. Albrecht U, Zheng B, Larkin D, Sun ZS, Lee CC. mPer1 and mper2 are essential for normal resetting of the circadian clock. J Biol Rhythms. 2001;16:100–104. - PubMed
    1. Antion M, Hou L, Wong H, Hoeffer CA, Klann E. mGluR-dependent long-term depression is associated with increased phosphorylation of S6 and synthesis of elongation factor 1A but remains expressed in S6K-deficient mice. Mol Cell Biol. 2008;28:2996–3007. - PMC - PubMed

Publication types

MeSH terms

Substances

LinkOut - more resources