. 2010 May 5;30(18):6342-54.
doi: 10.1523/JNEUROSCI.6176-09.2010.

Functional identification of a pulvinar path from superior colliculus to cortical area MT

Affiliations

Functional identification of a pulvinar path from superior colliculus to cortical area MT

Rebecca A Berman et al. J Neurosci. .

Abstract

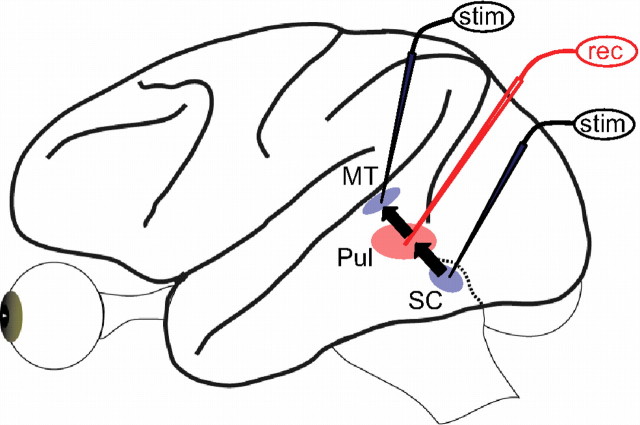
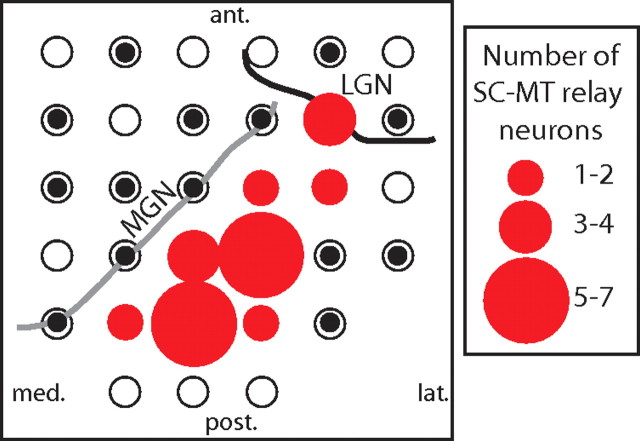
The idea of a second visual pathway, in which visual signals travel from brainstem to cortex via the pulvinar thalamus, has had considerable influence as an alternative to the primary geniculo-striate pathway. Existence of this second pathway in primates, however, is not well established. A major question centers on whether the pulvinar acts as a relay, particularly in the path from the superior colliculus (SC) to the motion area in middle temporal cortex (MT). We used physiological microstimulation to identify pulvinar neurons belonging to the path from SC to MT in the macaque. We made three salient observations. First, we identified many neurons in the visual pulvinar that received input from SC or projected to MT, as well as a largely separate set of neurons that received input from MT. Second, and more importantly, we identified a subset of neurons as relay neurons that both received SC input and projected to MT. The identification of these relay neurons demonstrates a continuous functional path from SC to MT through the pulvinar in primates. Third, we histologically localized a subset of SC-MT relay neurons to the subdivision of inferior pulvinar known to project densely to MT but also localized SC-MT relay neurons to an adjacent subdivision. This pattern indicates that the pulvinar pathway is not limited to a single anatomically defined region. These findings bring new perspective to the functional organization of the pulvinar and its role in conveying signals to the cerebral cortex.


Figures

Figure 1.
Figure 1.
Combined microstimulation (stim) and recording (rec) were used to identify single pulvinar neurons that belong to the ascending pathway from SC to pulvinar to MT. A microelectrode recorded spikes of a single pulvinar neuron. Stimulating microelectrodes activated neurons in the lower superficial layers of SC and in cortical area MT. This procedure established the connectivity of the pulvinar neuron on the basis of its orthodromic (synaptic) or antidromic (backfired) activation from SC and MT.
Figure 2.
Figure 2.
Example recording traces from a single pulvinar neuron show that it both receives input from SC and projects to MT, as evidenced by spikes evoked by stimulation of SC and MT. Each panel shows several stimulation trials superimposed; stimulus artifacts are erased for clarity. Time 0 indicates the start of stimulation (MT stimulation for the relay test). A, Orthodromic activation of the pulvinar cell indicates input from SC. Stimulation of SC causes the pulvinar neuron to fire a spike at a variable latency, ∼3 ms after stimulation. B, The orthodromic spike fails to collide with a spontaneous spike that precedes stimulation at short latency. C, Antidromic activation indicates output to MT. Stimulation of MT elicits a spike from the pulvinar neuron at a fixed latency (∼1.7 ms), consistent with backfiring the neuron. D, The collision test confirms antidromic activation. MT stimulation is triggered immediately after a spontaneous spike in the pulvinar, which collides with the backfired spike (asterisk denotes its absence on collision trials). This is in contrast to C, in which the triggering pulvinar spike occurs well before MT stimulation and therefore does not interfere with the antidromically evoked spike. E, F, The relay test demonstrates unequivocally that SC and MT stimulation activate the same pulvinar neuron. Here, MT stimulation follows a spike elicited by SC stimulation. E, Long delay between SC and MT stimulation does not cause collision, and the MT-evoked spike is observed. F, Short delay between SC and MT stimulation. The SC-evoked spike occurs just before MT stimulation and therefore collides the MT-evoked spike.
Figure 3.
Figure 3.
Visual field maps in the pulvinar indicate areas of retinotopic and nonretinotopic organization. The two columns show data from the left and right hemispheres of monkey YZ, in which extensive field mapping was conducted. Panels show drawings of coronal sections through the area of interest for the relay pathway, and move in 1 mm intervals from anterior (top) to posterior (bottom). A–C, Data from the left hemisphere begin at the level of the posterior pole of LGN (section P0, top panel). D–F, Data from the right hemisphere begin just posterior to the LGN (section P1). Each panel shows the location in depth in mm (y-axis) of visual neurons encountered at each medial–lateral site in the recording grid in mm (x-axis). In this and subsequent figures, medial is on the right and lateral on the left of each panel, regardless of hemisphere. Symbols indicate the field representation of the neuron and colors indicate approximate eccentricity of the receptive field (see legend). The black line denotes the estimated transition from lower to upper visual field representations (horizontal meridian). The vertical gray line denotes the estimated border between a retinotopic zone, in which we could detect a systematic transition from lower field to upper field representations as the electrode descended, and a nonretinotopic zone, in which no systematic pattern was detected. For the left hemisphere, maps include a small number of neurons obtained 0.5 mm posterior to the displayed section (obtained with an offset grid). Some pulvinar cells with connections are not displayed because they were lost before receptive fields were mapped, or were not readily driven by visual stimulation. Vertical dotted lines indicate sites at which recording was done but no visual neurons were encountered.
Figure 4.
Figure 4.
Location of pulvinar neurons with connections to SC and MT identified using microstimulation. Coronal planes are identical to those in Figure 3 (monkey YZ). Symbols indicate the four types of connections: input from SC, output to MT, relay neurons with both SC input and MT output, and input from MT (see legend). Landmarks for each panel are from Figure 3: MGN, LGN, representation of the horizontal meridian, and estimated border between retinotopic and nonretinotopic zones. Data obtained using slightly curved recording electrodes are shown with a small medial offset (right hemisphere, F only). Dotted lines indicate sites at which recording was done but no connected neurons were encountered. Conventions as in Figure 3.
Figure 5.
Figure 5.
Histological sections from the right hemisphere of monkey YZ show that relay neurons are located in the known MT-projection zone as well as an adjacent subdivision of inferior pulvinar. A, Section stained for calbindin reveals known subdivisions within the inferior pulvinar for the coronal plane in which relay neurons were identified. Solid lines indicate calbindin-identified subdivisions and other landmarks; the dashed line indicates the brachium of the SC (bsc), a fiber passage in which pulvinar neurons are interdigitated (Adams et al., 2000). Pulvinar labels follow the nomenclature of Stepniewska and Kaas (1997): PIp, inferior pulvinar posterior subdivision; PIm, medial subdivision; PIcm, central–medial subdivision; PIcl, central–lateral subdivision. Dotted lines for PIp indicate less certainty regarding its medial and dorsal border due to damage at the site of the electrolytic mark; it may extend more medially and above the brachium. The lateral border of PIcl was also less certain. The lightly stained region (calbindin hole) corresponds to the area known to project most densely to MT (PIm). B, The adjacent Nissl section shows the pattern of marks made by passing current through the recording microelectrode. Arrowheads identify marks on two penetrations including two sites at which relay neurons (red arrowheads) were recorded. Marks were used to align recording maps for C and D. C, Receptive field map from Figure 3E is superimposed on the outline of calbindin-defined subdivisions. D, The map of pulvinar neurons connected to SC and MT, from Figure 4E, is superimposed on the calbindin outline. Map conventions for C and D are from Figures 3 and 4, respectively. Relay neurons (red) were recorded both in PIm and in the more medial subdivision PIp.
Figure 6.
Figure 6.
Coronal maps show the location of identified pulvinar neurons sampled less densely from three other hemispheres. Each hemisphere is represented with a different color (see legend). The primary landmarks (MGN, LGN, and estimated border between retinotopic and nonretinotopic zones) are from the right hemisphere of monkey AM; data from the other two hemispheres were brought into register on the basis of MGN and LGN locations. Conventions as in Figure 4. R, Right; L, left; Hemi, hemisphere.
Figure 7.
Figure 7.
Top-down view of a composite grid map of the pulvinar shows the anterior–posterior and medial–lateral location of relay neurons. Data from all three monkeys (5 hemispheres) were brought into a common coordinate frame and superimposed onto the chamber map from the right hemisphere of monkey YZ. Lines represent the estimated posterior/medial border of LGN (black) and the lateral border of MGN (gray). Filled red circles denote the location of relay neurons; their diameter reflects the number at each site. Open circles indicate grid locations at which recording was conducted, and small black circles denote sites of nonrelay neurons that were connected to either SC or MT. ant., Anterior; post., posterior; lat., lateral; med., medial.
Figure 8.
Figure 8.
Composite map of all neurons with connections to SC or MT, combined from all five hemispheres. Each map shows the anterior–posterior and medial–lateral location of pulvinar neurons with connections to either SC or MT. A, Input from SC. B, Output to MT. C, Input from MT. Relay neurons are included in the counts for input from SC and output to MT. Conventions as in Figure 7. ant., Anterior; post., posterior; lat., lateral; med., medial.
Figure 9.
Figure 9.
A–C, Activation latencies of pulvinar neurons with input from SC (A), output to MT (B), and input from MT (C). Distribution of relay neurons are shown in red in A and B. In each panel, the x-axis shows the time in ms between the start of stimulation of SC or MT and the evoked spike in the pulvinar neuron, and the y-axis shows the number of neurons. Histograms were created using 1 ms bins. Arrows indicate median values, listed on the right. Numbers for the SC input population differ slightly from the total of identified neurons in this category because precise time measurements were not obtained for a small number of cells. Asterisk in B indicates a significant difference between antidromic MT latencies for the relay neurons compared with those with only identified MT output (p < 0.05, Wilcoxon rank-sum).

Similar articles

Cited by

References

    1. Adams MM, Hof PR, Gattass R, Webster MJ, Ungerleider LG. Visual cortical projections and chemoarchitecture of macaque monkey pulvinar. J Comp Neurol. 2000;419:377–393. - PubMed
    1. Baizer JS, Whitney JF, Bender DB. Bilateral projections from the parabigeminal nucleus to the superior colliculus in monkey. Exp Brain Res. 1991;86:467–470. - PubMed
    1. Baker J, Gibson A, Mower G, Robinson F, Glickstein M. Cat visual corticopontine cells project to the superior colliculus. Brain Res. 1983;265:227–232. - PubMed
    1. Bender DB. Retinotopic organization of macaque pulvinar. J Neurophysiol. 1981;46:672–693. - PubMed
    1. Benevento LA, Fallon JH. The ascending projections of the superior colliculus in the rhesus monkey (Macaca mulatta) J Comp Neurol. 1975;160:339–361. - PubMed

Publication types

LinkOut - more resources