. 2010 May 5;30(18):6422-33.
doi: 10.1523/JNEUROSCI.5086-09.2010.

Multiple kinase pathways regulate voltage-dependent Ca2+ influx and migration in oligodendrocyte precursor cells

Affiliations

Multiple kinase pathways regulate voltage-dependent Ca2+ influx and migration in oligodendrocyte precursor cells

Pablo M Paez et al. J Neurosci. .

Abstract

It is becoming increasingly clear that voltage-operated Ca(2+) channels (VOCCs) play a fundamental role in the development of oligodendrocyte progenitor cells (OPCs). Because direct phosphorylation by different kinases is one of the most important mechanisms involved in VOCC modulation, the aim of this study was to evaluate the participation of serine-threonine kinases and tyrosine kinases (TKs) on Ca(2+) influx mediated by VOCCs in OPCs. Calcium imaging revealed that OPCs exhibited Ca(2+) influx after plasma membrane depolarization via L-type VOCCs. Furthermore, VOCC-mediated Ca(2+) influx declined with OPC differentiation, indicating that VOCCs are developmentally regulated in OPCs. PKC activation significantly increased VOCC activity in OPCs, whereas PKA activation produced the opposite effect. The results also indicated that OPC morphological changes induced by PKC activation were partially mediated by VOCCs. Our data clearly suggest that TKs exert an activating influence on VOCC function in OPCs. Furthermore, using the PDGF response as a model to probe the role of TK receptors (TKr) on OPC Ca(2+) uptake, we found that TKr activation potentiated Ca(2+) influx after membrane depolarization. Interestingly, this TKr modulation of VOCCs appeared to be essential for the PDGF enhancement of OPC migration rate, because cell motility was completely blocked by TKr antagonists, as well as VOCC inhibitors, in migration assays. The present study strongly demonstrates that PKC and TKrs enhance Ca(2+) influx induced by depolarization in OPCs, whereas PKA has an inhibitory effect. These kinases modulate voltage-operated Ca(2+) uptake in OPCs and participate in the modulation of process extension and migration.


Figures

Figure 1.
Figure 1.
A, Fura-2 imaging of Ca2+ responses to 20 mm K+ in primary cultures of OPCs. The time of addition of high K+-containing external solution is indicated by the horizontal bar. Note that each trace corresponds to a single cell. B, K+-induced Ca2+ uptake was increased in 5 μm Bay K 8644 and abolished in 10 μm Cd2+, 25 μm verapamil, 25 μm nifedipine, and in the absence of external Ca2+ (−Ca2+). The graph shows the average amplitude (Peak) calculated from the responding cells, expressed as percentage of change of the emission intensities. Each agonist was applied by a fast and local perfusion system. Values are expressed as mean ± SEM of at least four independent experiments (n > 500 cells for each condition). **p < 0.01, ***p < 0.001 versus basal.
Figure 2.
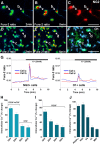
Figure 2.
A–F, Immunocytochemical staining for the NG2 (C) and O1 antigen (F) were used after confocal calcium imaging (A, B and D, E) to determine the developmental stage at which OLs responded to high K+. Four selected OLs in these microscope fields (a–d) responded to high K+. Examination of the same field after NG2 (C) and O1 (F) staining indicated that OLs at NG2+ stage responded to high K+ with large increases in intracellular Ca2+, whereas O1+ cells displayed small Ca2+ uptake. Intracellular Ca2+ in these selected cells are plotted with respect to the time of stimulation in G. H, Pure OPCs were cultured for 2 d in vitro (1 and 2 DIV) in defined culture media plus PDGF (10 ng/ml) and bFGF (10 ng/ml). Then the medium was changed and the cells were cultured in a mitogen-free medium (mN2) for another 2 d (3 and 4 DIV). I, Pure OPCs were cultured for 4 DIV in defined culture media plus PDGF (10 ng/ml). The graphs shows the average Ca2+ influx amplitude after high K+ treatment in each experimental condition (n > 200 cells for each condition). J, Immunocytochemical staining for PDGFrα, NG2, O4, O1, and MBP were used after confocal calcium imaging at 2 DIV. The graphs shows the average Ca2+ influx amplitude calculated from 50 responding cells for each OL marker, expressed as percentage of change of the emission intensities. Values are expressed as mean ± SEM of at least four independent experiments. Scale bars: C, 20 μm; F, 40 μm.
Figure 3.
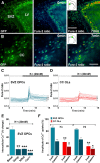
Figure 3.
Brain slices were incubated in a stage top chamber with 5% CO2 at 37°C. Fura-2 images were obtained for brain slices at 5 s intervals for a total of 15 min. A, B, Time-lapse series of P4 GFP-expressing OPCs in the dorsolateral SVZ (A) and in the CC (B). Each frame represents a single section of a fura-2 time-lapse experiment. An increased fura-2 fluorescence ratio is indicated by warmer colors. Time is denoted in minutes in the top right corner, and the area of the CC and SVZ is indicated in the inset. LV, Lateral ventricle. Scale bars: A, 100 μm; B, 50 μm. C, D, VOCC activity was examined in P4 GFP-expressing OPCs from the SVZ area and OLs from the CC. Note that each trace corresponds to a single cell, and the time of addition of external solution containing high K+ is indicated by the horizontal bars. E, K+-induced Ca2+ uptake in P4 OPCs from the SVZ was abolished in 25 μm verapamil, in 25 μm nifedipine, and in the absence of external Ca2+ (−Ca2+). The graph show the average amplitude calculated from the responding cells, expressed as percentage of change of the emission intensities. F, VOCC activity was examined in P4 and P8 GFP-expressing OPCs from the SVZ area and OLs from the CC. The graph show the average maximal peak values and plateau values during minutes 9–11, calculated from the responding cells, expressed as percentage of change of the emission intensities. Values are expressed as mean ± SEM of at least four independent experiments (n > 200 cells for each condition). *p < 0.05, **p < 0.01, ***p < 0.001 versus basal (E) and versus SVZ OPCs (F).
Figure 4.
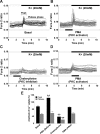
Figure 4.
A, Fura-2 imaging of Ca2+ response to 20 mm K+ in control OPCs (Basal). B, C, Effect of PMA (10 μm) (B) and chelerythrine (50 μm) (C) on Ca2+ influx induced by high K+ in OPCs. As indicated by the horizontal bars, the phorbol ester PMA and the PKC inhibitor chelerythrine were applied 2 min before high K+ stimulation. D, The PKC activator PMA (10 μm) was applied after K+ stimulation. E, The graph show the average maximal peak values and plateau values (minutes 5–7) for each experimental condition, calculated from the responding cells and expressed as percentage of change of the emission intensities. Values are expressed as mean ± SEM of at least four independent experiments (n > 200 cells for each condition). **p < 0.01 versus respective basal levels.
Figure 5.
Figure 5.
A, Effect of the PKA inhibitor H89 (25 μm) and the PKA activators 8-PIP and 8-AHA-cAMP (10 μm) on Ca2+ influx induced by high K+ in OPCs. The cells were treated with these PKA modulators 2 min before and during depolarization with high K+. The graph show the average maximal peak values and plateau values during minutes 5–7, calculated from the responding cells, expressed as percentage of change of the emission intensities. Values are expressed as mean ± SEM of at least four independent experiments (n > 200 cells for each condition). *p < 0.05, **p < 0.01 versus respective basal levels. B, Fura-2 imaging of Ca2+ response to 20 mm K+ in selected OPCs from control (Basal) and treated cultures with the PKA modulators (8-PIP-cAMP and 8-AHA-cAMP (10 μm) during high K+ depolarization. The time of addition of high K+-containing external solution and the PKA activators is indicated by the horizontal bars.
Figure 6.
Figure 6.
A, D, The percentage of OPCs with processes greater or equal to four times the cell body diameter is indicated as a function of the concentration of PMA (A) or verapamil and nifedipine (D) used in the incubation media. B, Quantitative morphometric analyses of primary (PP) and secondary (SP) process outgrowth in control and PMA-treated OPCs after 2 DIV. Values are expressed as mean ± SEM of at least four independent experiments (n > 50 cells for each condition). *p < 0.05, **p < 0.01 versus control cells (Basal). C, PKC activity was examined in primary cultures of OPCs. The graph show the average PKC activity during 24 h under different experimental conditions. PKC activity was detected as described in Materials and Methods, and values are expressed as mean ± SEM of at least three independent experiments. E, Fluorescent images of OPCs immunostained with the O4 antibody after 2 DIV (a) and cells treated with PMA (1 μm) for 2 DIV appeared broader and had elaborated extensive processes (b). However, the presence of verapamil (25 or 50 μm) in the culture media completely inhibited the PMA effect on OPC morphology (c, d). Scale bar, 25 μm.
Figure 7.
Figure 7.
A, Fura-2 imaging of Ca2+ response to 20 mm K+ in control OPCs (Basal). B, C, Effect of genistein (10 μm) (B) and the tyrosine phosphatase inhibitor orthovanadate (5 μm) (C) on Ca2+ influx induced by high K+ in OPCs. The time of addition of high K+-containing external solution and the TK modulators is indicated by the horizontal bars. D, The graph show the average maximal peak values and plateau values during minutes 5–7, calculated from the responding cells, expressed as percentage of change of the emission intensities. Values are expressed as mean ± SEM of at least four independent experiments (n > 200 cells for each condition). *p < 0.05, **p < 0.01 versus respective basal levels.
Figure 8.
Figure 8.
A, Effect of different concentrations of PDGF on Ca2+ influx induced by high K+ in OPCs. The graph show the average maximal peak values and plateau values in the presence of different PDGF concentrations. B, Fura-2 imaging of Ca2+ response to 20 mm K+ in selected OPCs from control and treated cultures with the TKr inhibitor AG-1296 (1 μm) applied 2 min before high K+. C, OPCs were treated with AG-1296 (1 μm) or genistein (10 μm) in the presence of 20 or 40 ng/ml PDGF. The graph show the amplitude of Ca2+ uptake (peak) calculated from the responding cells. Values are expressed as mean ± SEM of at least four independent experiments (n > 200 cells for each condition). **p < 0.01, ***p < 0.001 versus respective control levels.
Figure 9.
Figure 9.
Cultured OPCs were incubated in a stage top chamber with 5%CO2 at 37°C, which was placed on the stage of a spinning disc confocal inverted microscope. A, Bright-field images were acquired at 6 min intervals for a total of 24 h. Each frame represents a single section of a time-lapse video sequence. Time is denoted in hours in the bottom left corner. Arrows indicates the direction of migration, and therefore the length of the arrow represents the relative velocity of the cell at that moment. Cell migration speed and distances were analyzed offline by tracing individual cells at different times, after which migratory values were statistically analyzed. B, OPC average migration speed was calculated from at least 50 cells in each experimental condition. C, Total migration distance was followed for 8 h in 150 cells from each experimental condition. Values are expressed as mean ± SEM of at least four independent experiments. *p < 0.05, **p < 0.01 versus control cells (PDGF 10 ng/ml). Scale bar, 30 μm.
Figure 10.
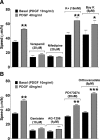
Figure 10.
Average migration speed obtained from cultured OPCs bathed in basal medium (PDGF at 10 ng/ml) or in the presence of 40 ng/ml PDGF. A, The effect of VOCC modulators (verapamil, nifedipine, K+, and Bay K 8644) on OPC migration is shown. B, The role of TKs and TKr on OPC mobility was evaluated using genistein, AG-1296, PD173074, and sodium orthovanadate. OPC average migration speed was calculated from at least 50 cells in each experimental condition. Values are expressed as mean ± SEM of at least four independent experiments. *p < 0.05, **p < 0.01, ***p < 0.001 versus control cells (PDGF at 10 ng/ml).

Similar articles

Cited by

References

    1. Agresti C, D'Urso D, Levi G. Reversible inhibitory effects of interferon-γ and tumor necrosis factor-α on oligodendroglial lineage cell proliferation and differentiation in vitro. Eur J Neurosci. 1996;8:1106–1116. - PubMed
    1. Akopian G, Kressin K, Derouiche A, Steinhäuser C. Identified glial cells in the early postnatal mouse hippocampus display different types of Ca2+ currents. Glia. 1996;17:181–194. - PubMed
    1. Althaus HH, Schröter J, Spoerri P, Schwartz P, Klöppner S, Rohmann A, Neuhoff V. Protein kinase C stimulation enhances the process formation of adult oligodendrocytes and induces proliferation. J Neurosci Res. 1991;29:481–489. - PubMed
    1. Amur-Umarjee S, Phan T, Campagnoni AT. Myelin basic protein mRNA translocation in oligodendrocytes is inhibited by astrocytes in vitro. J Neurosci Res. 1993;36:99–110. - PubMed
    1. Avossa D, Pfeiffer SE. Transient reversion of O4+ GalC− oligodendrocyte progenitor development in response to the phorbol ester TPA. J Neurosci Res. 1993;34:113–128. - PubMed

Publication types

MeSH terms