. 2010 May 11;107 Suppl 2(Suppl 2):8954-61.
doi: 10.1073/pnas.0914618107. Epub 2010 May 5.

Colloquium paper: genome-wide patterns of population structure and admixture among Hispanic/Latino populations

Affiliations

Colloquium paper: genome-wide patterns of population structure and admixture among Hispanic/Latino populations

Katarzyna Bryc et al. Proc Natl Acad Sci U S A. .

Abstract

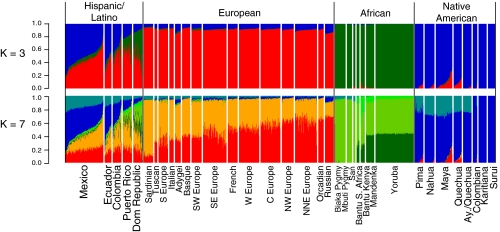
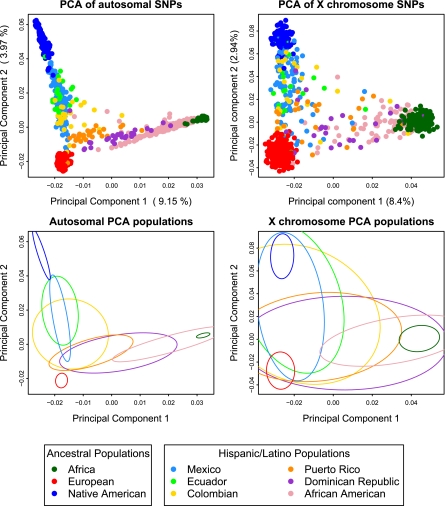
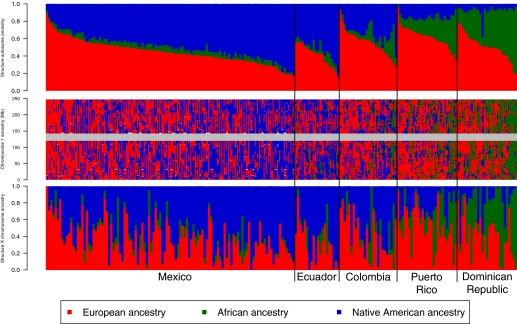
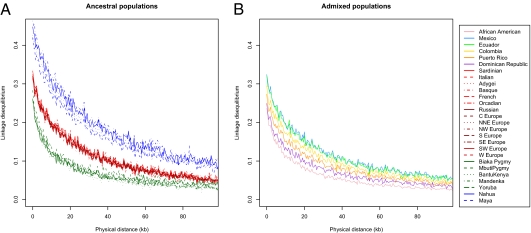
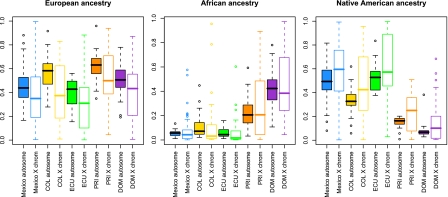
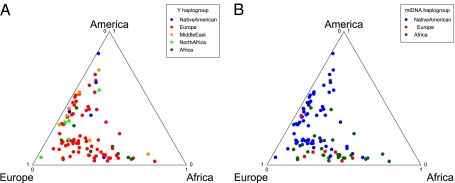
Hispanic/Latino populations possess a complex genetic structure that reflects recent admixture among and potentially ancient substructure within Native American, European, and West African source populations. Here, we quantify genome-wide patterns of SNP and haplotype variation among 100 individuals with ancestry from Ecuador, Colombia, Puerto Rico, and the Dominican Republic genotyped on the Illumina 610-Quad arrays and 112 Mexicans genotyped on Affymetrix 500K platform. Intersecting these data with previously collected high-density SNP data from 4,305 individuals, we use principal component analysis and clustering methods FRAPPE and STRUCTURE to investigate genome-wide patterns of African, European, and Native American population structure within and among Hispanic/Latino populations. Comparing autosomal, X and Y chromosome, and mtDNA variation, we find evidence of a significant sex bias in admixture proportions consistent with disproportionate contribution of European male and Native American female ancestry to present-day populations. We also find that patterns of linkage-disequilibria in admixed Hispanic/Latino populations are largely affected by the admixture dynamics of the populations, with faster decay of LD in populations of higher African ancestry. Finally, using the locus-specific ancestry inference method LAMP, we reconstruct fine-scale chromosomal patterns of admixture. We document moderate power to differentiate among potential subcontinental source populations within the Native American, European, and African segments of the admixed Hispanic/Latino genomes. Our results suggest future genome-wide association scans in Hispanic/Latino populations may require correction for local genomic ancestry at a subcontinental scale when associating differences in the genome with disease risk, progression, and drug efficacy, as well as for admixture mapping.


Conflict of interest statement

The authors declare no conflict of interest.

Figures

Fig. 1.
Fig. 1.
Frappe clustering illustrating the admixed ancestry of Hispanic/Latinos shown for K = 3 and K = 7. Individuals are shown as vertical bars colored in proportion to their estimated ancestry within each cluster. Native American populations are listed in order geographically, from North to South.
Fig. 2.
Fig. 2.
Principal component analysis results of the Hispanic/Latino individuals with Europeans, Africans, and Native Americans. PC 1 vs. PC 2 scatter plots based on autosomal markers (Upper Left) and based on X chromosome markers (Upper Right). Ellipses are fitted to the PCA results on the autosomes (Lower Left) and to results from the X chromosome markers (Lower Right).
Fig. 3.
Fig. 3.
Genome-wide and locus specific ancestry estimates for Mexicans, Ecuadorians, Colombians, Puerto Ricans, and Dominicans. Shown for K = 3, clustering of the Hispanic/Latino individuals on the autosomes (Top) and on the X chromosome (Bottom). Individuals are shown as vertical bars colored in proportion to their estimated ancestry within each cluster. Local ancestry at each locus is shown for each individual on chromosome 1 (Middle). The X chromosome shows greater Native American ancestry (blue) and greater variability in African ancestry (green), with reduced European ancestry (red).
Fig. 4.
Fig. 4.
Linkage disequilibrium, genotype r2 estimated by PLINK, by population as a function of physical distance (Mb). (Left) Native American, European, and African populations. (Right) Hispanic/Latino populations. Scale is the same.
Fig. 5.
Fig. 5.
Boxplots comparing autosomal vs. X chromosome ancestry proportions by population, shown for European ancestry (Left), Native American ancestry (Center), and African ancestry (Right). Filled boxes correspond to autosomal ancestry estimates; open boxes show X chromosome ancestry estimates. Median (solid line), first and third quartiles (box) and the minimum/maximum values, or to the smallest value within 1.5 times the IQR from the first quartile (whiskers). For each paired comparison of X chromosomes and autosomes, median Native American ancestries are consistently higher on the X chromosome in all Hispanic/Latino populations sampled, and European ancestries are lower across all populations.
Fig. 6.
Fig. 6.
Comparison of mtDNA and Y chromosome haplotypes. Each individual is represented by a point within the triangle that represents the autosomal ancestry proportions. The most probable continental location for each individual’s haplotype is designated by the color of the point. The Y chromosome contains a disproportionate number of European haplotypes, whereas the mtDNA has a high proportion of Native American, slightly more African haplotypes and fewer European haplotypes, consistent with a sex bias toward a great European male and Native American/African female ancestry in the Hispanic/Latinos.

Similar articles

Cited by

  • Novel risk loci for COVID-19 hospitalization among admixed American populations.
    Diz-de Almeida S, Cruz R, Luchessi AD, Lorenzo-Salazar JM, de Heredia ML, Quintela I, González-Montelongo R, Nogueira Silbiger V, Porras MS, Tenorio Castaño JA, Nevado J, Aguado JM, Aguilar C, Aguilera-Albesa S, Almadana V, Almoguera B, Alvarez N, Andreu-Bernabeu Á, Arana-Arri E, Arango C, Arranz MJ, Artiga MJ, Baptista-Rosas RC, Barreda-Sánchez M, Belhassen-Garcia M, Bezerra JF, Bezerra MAC, Boix-Palop L, Brion M, Brugada R, Bustos M, Calderón EJ, Carbonell C, Castano L, Castelao JE, Conde-Vicente R, Cordero-Lorenzana ML, Cortes-Sanchez JL, Corton M, Darnaude MT, De Martino-Rodríguez A, Del Campo-Pérez V, de Bustamante AD, Domínguez-Garrido E, Eirós R, Fariñas MC, Fernandez-Nestosa MJ, Fernández-Robelo U, Fernández-Rodríguez A, Fernández-Villa T, Gago-Dominguez M, Gil-Fournier B, Gómez-Arrue J, Álvarez BG, Bernaldo de Quirós FG, González-Neira A, González-Peñas J, Gutiérrez-Bautista JF, Herrero MJ, Herrero-Gonzalez A, Jimenez-Sousa MA, Lattig MC, Borja AL, Lopez-Rodriguez R, Mancebo E, Martín-López C, Martín V, Martinez-Nieto O, Martinez-Lopez I, Martinez-Resendez MF, Martinez-Perez A, Mazzeu JF, Macías EM, Minguez P, Cuerda VM, Oliveira SF, Ortega-Paino E, Parellada M, Paz-Artal… See abstract for full author list ➔ Diz-de Almeida S, et al. Elife. 2024 Oct 3;13:RP93666. doi: 10.7554/eLife.93666. Elife. 2024. PMID: 39361370 Free PMC article.
  • Genetic analysis of ancestry, admixture and selection in Bolivian and Totonac populations of the New World.
    Watkins WS, Xing J, Huff C, Witherspoon DJ, Zhang Y, Perego UA, Woodward SR, Jorde LB. Watkins WS, et al. BMC Genet. 2012 May 20;13:39. doi: 10.1186/1471-2156-13-39. BMC Genet. 2012. PMID: 22606979 Free PMC article.
  • Ancestry effects on type 2 diabetes genetic risk inference in Hispanic/Latino populations.
    Chande AT, Rishishwar L, Conley AB, Valderrama-Aguirre A, Medina-Rivas MA, Jordan IK. Chande AT, et al. BMC Med Genet. 2020 Jun 25;21(Suppl 2):132. doi: 10.1186/s12881-020-01068-0. BMC Med Genet. 2020. PMID: 32580712 Free PMC article.
  • Development of a panel of genome-wide ancestry informative markers to study admixture throughout the Americas.
    Galanter JM, Fernandez-Lopez JC, Gignoux CR, Barnholtz-Sloan J, Fernandez-Rozadilla C, Via M, Hidalgo-Miranda A, Contreras AV, Figueroa LU, Raska P, Jimenez-Sanchez G, Zolezzi IS, Torres M, Ponte CR, Ruiz Y, Salas A, Nguyen E, Eng C, Borjas L, Zabala W, Barreto G, González FR, Ibarra A, Taboada P, Porras L, Moreno F, Bigham A, Gutierrez G, Brutsaert T, León-Velarde F, Moore LG, Vargas E, Cruz M, Escobedo J, Rodriguez-Santana J, Rodriguez-Cintrón W, Chapela R, Ford JG, Bustamante C, Seminara D, Shriver M, Ziv E, Burchard EG, Haile R, Parra E, Carracedo A; LACE Consortium. Galanter JM, et al. PLoS Genet. 2012;8(3):e1002554. doi: 10.1371/journal.pgen.1002554. Epub 2012 Mar 8. PLoS Genet. 2012. PMID: 22412386 Free PMC article.
  • Ancestral components of admixed genomes in a Mexican cohort.
    Johnson NA, Coram MA, Shriver MD, Romieu I, Barsh GS, London SJ, Tang H. Johnson NA, et al. PLoS Genet. 2011 Dec;7(12):e1002410. doi: 10.1371/journal.pgen.1002410. Epub 2011 Dec 15. PLoS Genet. 2011. PMID: 22194699 Free PMC article.

References

    1. Sans M. Admixture studies in Latin America: From the 20th to the 21st century. Hum Biol. 2000;72:155–177. - PubMed
    1. Wang S, et al. Geographic patterns of genome admixture in Latin American Mestizos. PLoS Genet. 2008;4:e1000037. - PMC - PubMed
    1. Seldin MF, et al. Argentine population genetic structure: Large variance in Amerindian contribution. Am J Phys Anthropol. 2007;132:455–462. - PMC - PubMed
    1. Silva-Zolezzi I, et al. Analysis of genomic diversity in Mexican Mestizo populations to develop genomic medicine in Mexico. Proc Natl Acad Sci USA. 2009;106:8611–8616. - PMC - PubMed
    1. Dipierri JE, et al. Paternal directional mating in two Amerindian subpopulations located at different altitudes in northwestern Argentina. Hum Biol. 1998;70:1001–1010. - PubMed

Publication types

Substances