Comparative Study
. 2010 Aug;299(2):C477-87.
doi: 10.1152/ajpcell.00427.2009. Epub 2010 May 5.

Biophysical properties of mitochondrial fusion events in pancreatic beta-cells and cardiac cells unravel potential control mechanisms of its selectivity

Affiliations
Comparative Study

Biophysical properties of mitochondrial fusion events in pancreatic beta-cells and cardiac cells unravel potential control mechanisms of its selectivity

Gilad Twig et al. Am J Physiol Cell Physiol. 2010 Aug.

Abstract

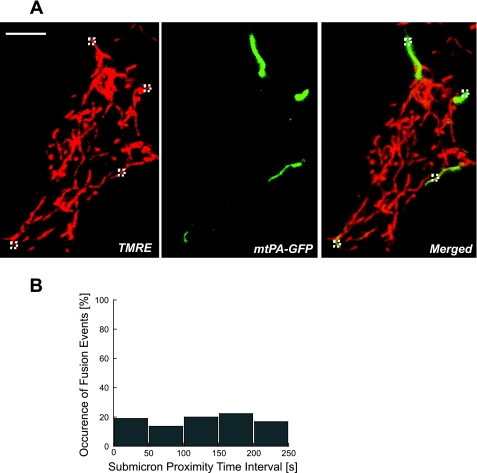
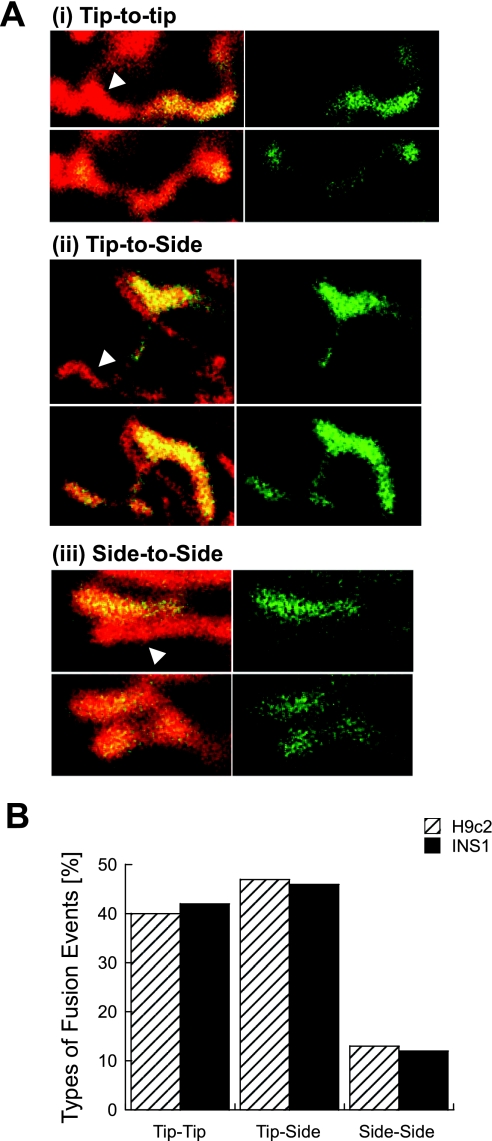
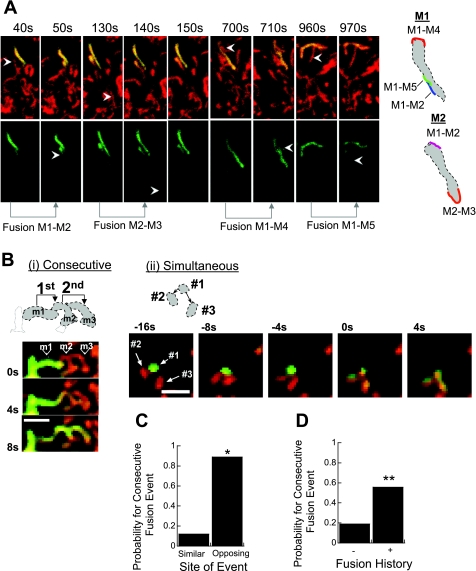
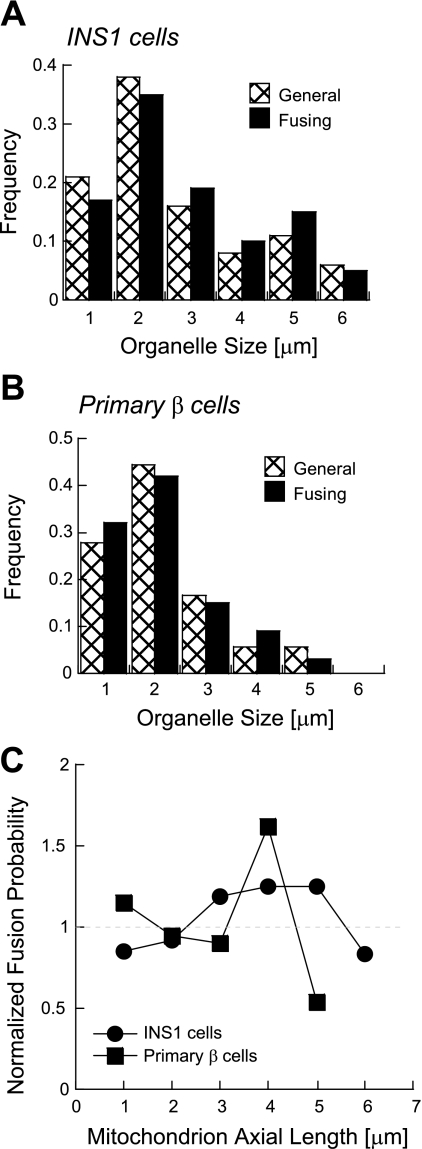
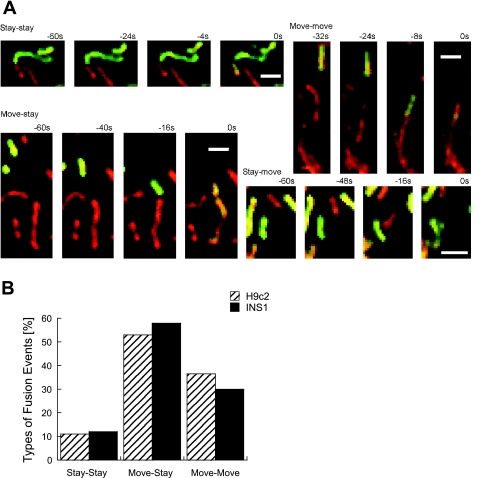
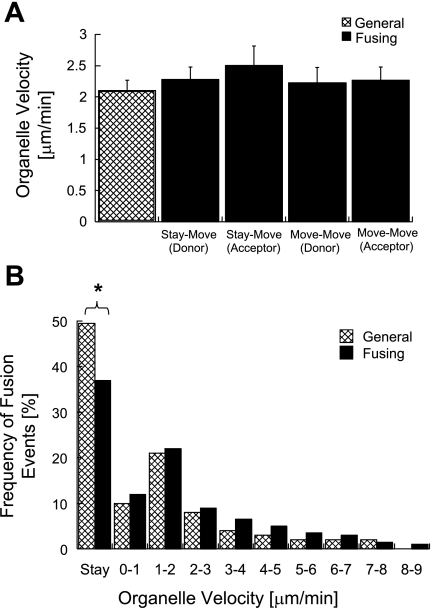
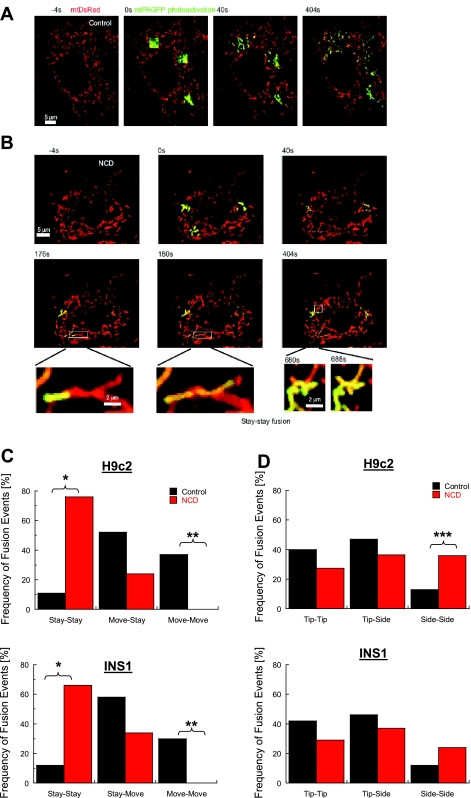
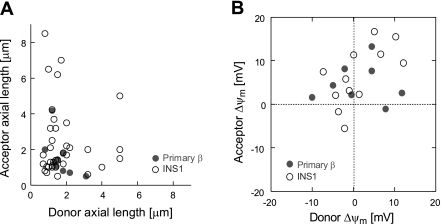
Studies in various types of cells find that, on average, each mitochondrion becomes involved in a fusion event every 15 min, depending on the cell type. As most contact events do not result in mitochondrial fusion, it is expected that properties of the individual mitochondrion determine the likelihood of a fusion event. However, apart from membrane potential, the properties that influence the likelihood of entering a fusion event are not known. Here, we tag and track individual mitochondria in H9c2, INS1, and primary beta-cells and determine the biophysical properties that increase the likelihood of a fusion event. We found that the probability for fusion is independent of contact duration and organelle dimensions, but it is influenced by organelle motility. Furthermore, the history of a previous fusion event of the individual mitochondrion influenced both the likelihood for a subsequent fusion event, as well as the site on the mitochondrion at which the fusion occurred. These observations unravel the specific properties that distinguish mitochondria that will enter fusion events from the ones that will not. Altogether, these properties may help to elucidate the molecular mechanisms that regulate fusion at the level of the single mitochondrion.


Figures

Fig. 1.
Fig. 1.
Differentiating between intermitochondrial contact and actual fusion. A: INS1 cell expressing matrix-targeted photoactivatable green fluorescent protein (GFP) (mtPA-GFP) that underwent 4 sequential photoactivation steps (each denoted with a small dashed square). Note the dense organization of discrete networks. B: individual mitochondria (n = 64) were tagged with PA-GFPmt and contacts (as judged from a submicron proximity; n = 170) and overt fusion events (n = 31) with neighbored nonphotoactivated mitochondria were classified according to the time duration interval. Note that the probability of intermitochondrial contact to develop to overt fusion is independent of the time interval.
Fig. 2.
Fig. 2.
Dependency of mitochondrial fusion upon orientation. A: example for the three orientations involving the tip and the side of the organelle. The acceptor mitochondrion is indicated with an arrow in the prefusion frame of each orientation are shown (top row of images in each panel). B: distribution of fusion orientation 155 events in H9c2 cells and 47 events in INS1 cells.
Fig. 3.
Fig. 3.
Repetitive fusion events in the same mitochondrion can occur at different sites. A: an experiment showing consecutive cycles of a fusion event followed by a fission event in INS1 mitochondria (fission events are not shown). The two mitochondria (labeled as M1 and M2) underwent a total of five cycles of fusion-fission events during a recording period of 20 min (only 4 cycles are shown). Note that in both mitochondria the consecutive fusion site was located in the opposite portion of the mitochondrion. Arrowheads indicate the acceptor mitochondrion in pre- and postfusion frames. B: consecutive (i) and simultaneous (ii) multiorganelle fusion events in two different H9c2 cells. Bar = 2 μm. C: probability for the occurrence of a repetitive fusion event in a given INS1 mitochondrion at the same or opposite portion (n = 12 fusion events; *P = 0.025). The orientation of the recurrent event in INS1 cells was set relative to the occurrence of the first event or to the site where most fusion events occurred. The frequency was normalized to the total number of events (n = 12). D: fusion event increases the probability for a consecutive fusion event. Data summarize 10 experiments that included 29 physical contacts of which 16 (55%) developed to full fusion event (**P = 0.006).
Fig. 4.
Fig. 4.
Dependency of fusion frequency upon mitochondrial length. A and B: distribution of the axial length of all the mitochondria involved in fusion events in INS1 (A, n = 74) and primary β cells (B, n = 24) is shown. The general distribution of mitochondrial length irrespective of fusion occurrence in individual mitochondria tagged by photoactivation is shown for comparison. There was insignificant difference between the two distributions (P > 0.3 for each bin). C: ratio between the two distributions is plotted for each bin.
Fig. 5.
Fig. 5.
Mitochondrial movement and fusion. A: time course of typical mitochondrial fusion events in H9c2 cells: stay-stay, move-move, move-stay, and stay-move. Bar = 2 μm. B: distribution of stay-stay, move-move, move-stay, and stay-move in occurrence of fusion events in H9c2 cells (n = 213) and in INS1 cells (n = 47).
Fig. 6.
Fig. 6.
Mitochondrial movement velocity before fusion. A: H9c2 mean mitochondrial velocity of donor (n = 48) in move-stay, acceptor in stay-move (n = 61), donor and acceptor (n = 78) in move-move. No significance was found between these three velocities (P > 0.3 for every bin). B: velocity distribution of H9c2 fusing mitochondria (n = 426) is compared with general mitochondrial population irrespective of dynamics activity (n = 200). Smaller fraction of stationary mitochondria was found in the fusing population (37% vs. 49%, *P = 0.05). The velocity distribution was similar for motile mitochondria in the two populations.
Fig. 7.
Fig. 7.
Affect of cytoskeleton disruption on mitochondrial fusion. A: visualization of mitochondrial fusion by photoactivation in H9c2 nontreated cells. B: visualization of mitochondrial fusion by photoactivation in 10 μM Nocodazol (NCD)-pretreated (20 min) H9c2 cell. Two typical stay-stay fusion events were shown. Summary of fusion events (n = 15) in the presence of NCD. C: distribution for engagements according to motility in H9c2 and INS1 cells (*P < 0.0001; **P = 0.01). Move-stay were similar between the two groups (P > 0.3). D: summary of the same events in C for tip and side engagements (***P = 0.05).
Fig. 8.
Fig. 8.
Bioenergetic dependence and consequence of single mitochondrial fusion. A: energetic properties of mitochondria engaging in a fusion event. The membrane potential of each mitochondrion was taken up to 40 s before occurrence of fusion and is represented relative to the average mitcochondrial membrane potential (Δψm) of the cell. Results summarize 12 events in INS1 cells and 8 events in primary β-cells. B: the relationship between the length of the mitochondrial donor and acceptor that are involved in fusion. Data are a summary of 37 fusion events in INS1 cells and 12 events in primary β cells.

References

    1. Arimura S, Yamamoto J, Aida GP, Nakazono M, Tsutsumi N. Frequent fusion and fission of plant mitochondria with unequal nucleoid distribution. Proc Natl Acad Sci USA 101: 7805–7808, 2004 - PMC - PubMed
    1. Berman SB, Chen YB, Qi B, McCaffery JM, Rucker EB, 3rd, Goebbels S, Nave KA, Arnold BA, Jonas EA, Pineda FJ, Hardwick JM. Bcl-x L increases mitochondrial fission, fusion, and biomass in neurons. J Cell Biol 184: 707–719, 2009 - PMC - PubMed
    1. Bindokas VP, Kuznetsov A, Sreenan S, Polonsky KS, Roe MW, Philipson LH. Visualizing superoxide production in normal and diabetic rat islets of Langerhans. J Biol Chem 278: 9796–9801, 2003 - PubMed
    1. Busch KB, Bereiter-Hahn J, Wittig I, Schagger H, Jendrach M. Mitochondrial dynamics generate equal distribution but patchwork localization of respiratory. Complex I Mol Membr Biol 23: 509–520, 2006 - PubMed
    1. Chada SR, Hollenbeck PJ. Mitochondrial movement and positioning in axons: the role of growth factor signaling. J Exp Biol 206: 1985–1992, 2003 - PubMed

Publication types

LinkOut - more resources