Comparative Study
. 2010 Aug;299(2):C464-76.
doi: 10.1152/ajpcell.00563.2009. Epub 2010 May 5.

Bioenergetic characterization of mouse podocytes

Affiliations
Comparative Study

Bioenergetic characterization of mouse podocytes

Yoshifusa Abe et al. Am J Physiol Cell Physiol. 2010 Aug.

Abstract

Mitochondrial dysfunction contributes to podocyte injury, but normal podocyte bioenergetics have not been characterized. We measured oxygen consumption rates (OCR) and extracellular acidification rates (ECAR), using a transformed mouse podocyte cell line and the Seahorse Bioscience XF24 Extracellular Flux Analyzer. Basal OCR and ECAR were 55.2 +/- 9.9 pmol/min and 3.1 +/- 1.9 milli-pH units/min, respectively. The complex V inhibitor oligomycin reduced OCR to approximately 45% of baseline rates, indicating that approximately 55% of cellular oxygen consumption was coupled to ATP synthesis. Rotenone, a complex I inhibitor, reduced OCR to approximately 25% of the baseline rates, suggesting that mitochondrial respiration accounted for approximately 75% of the total cellular respiration. Thus approximately 75% of mitochondrial respiration was coupled to ATP synthesis and approximately 25% was accounted for by proton leak. Carbonyl cyanide p-trifluoromethoxyphenylhydrazone (FCCP), which uncouples electron transport from ATP generation, increased OCR and ECAR to approximately 360% and 840% of control levels. FCCP plus rotenone reduced ATP content by 60%, the glycolysis inhibitor 2-deoxyglucose reduced ATP by 35%, and 2-deoxyglucose in combination with FCCP or rotenone reduced ATP by >85%. The lactate dehydrogenase inhibitor oxamate and 2-deoxyglucose did not reduce ECAR, and 2-deoxyglucose had no effect on OCR, although 2-deoxyglucose reduced ATP content by 25%. Mitochondrial uncoupling induced by FCCP was associated with increased OCR with certain substrates, including lactate, glucose, pyruvate, and palmitate. Replication of these experiments in primary mouse podocytes yielded similar data. We conclude that mitochondria play the primary role in maintaining podocyte energy homeostasis, while glycolysis makes a lesser contribution.


Figures

Fig. 1.
Fig. 1.
Baseline energetics and intracellular ATP levels. A: basal oxygen consumption rate (OCR, left y-axis) and basal extracellular acidification rate (ECAR, right y-axis) in transformed podocytes and primary podocytes. OCR was significantly higher in primary podocytes (P < 0.0001, unpaired t-test), while ECAR was similar in the 2 cell types. Each data point represents mean ± SD (n = 20) and is representative of 11 independent experiments in transformed podocytes and 3 independent experiments in primary podocytes. mpH, milli-pH units. B: intracellular ATP level was measured in response to mitochondrial uncoupler carbonyl cyanide p-trifluoromethoxyphenylhydrazone (FCCP, 3 μM), glycolysis inhibitor 2-deoxyglucose (2-DG, 100 mM), and complex I inhibitor rotenone (1 μM) treatment for 45 min, individually or in combination as shown, in cultured mouse podocytes. ATP level is expressed as % of control, which was defined as the baseline value in cells exposed only to vehicle. Each data point represents mean ± SD (n = 4). Control vs. 2-DG, FCCP, 2-DG vs. FCCP, and 2-DG + FCCP + rotenone, all ***P < 0.001 vs. vehicle control, by ANOVA. This is representative of 2 independent experiments. Viability of the treated cells remained similar to control, as shown by calcein AM stain (top). Each data point represents mean ± SD (n = 4; all P > 0.05 vs. vehicle control, by ANOVA). C: administering 2-DG before FCCP and rotenone injection had no additional effect on OCR and ECAR, but administering 2-DG after FCCP and rotenone injection decreased ECAR. Each data point represents mean ± SE (n = 5), and results are representative of 2 independent experiments.
Fig. 2.
Fig. 2.
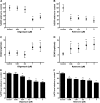
Dose titration of oligomycin and rotenone. Shown are OCR, ECAR, and ATP levels for transformed podocytes. F1F0 ATP synthase inhibitor oligomycin and complex I inhibitor rotenone suppressed respiration (A, B) and stimulated glycolysis (C, D). Each data point represents mean ± SD (n = 4), and results are representative of 2 independent experiments. With oligomycin and with rotenone, ATP levels fell, indicating that increased glycolysis was insufficient to compensate for reduced respiration and thus to meet cellular energy demand (E, F). ATP level is expressed as % of control, which was the value in cells exposed only to vehicle. Each data point represents mean ± SD (n = 4), and results are representative of 2 independent experiments (**P < 0.01 vs. vehicle control, by ANOVA).
Fig. 3.
Fig. 3.
Contribution of mitochondrial respiration to cellular ATP synthesis. Mitochondrial respiration was calculated from OCR under basal conditions and after the addition of oligomycin (1 μM) and rotenone (1 μM). Each data point represents mean ± SD of the last 3 of 6 rates for transformed podocytes (n = 10 replicates, left) and primary podocytes (n = 6 replicates, right). Experiment was performed 3 times with transformed podocytes and once with primary podocytes. These data indicate that in both transformed and primary podocytes mitochondrial respiration accounts for 77% of OCR and ATP generation accounts for 53% and 59% of OCR in transformed podocytes and primary podocytes, respectively.
Fig. 4.
Fig. 4.
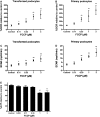
Dose titration of FCCP. The mitochondrial uncoupler FCCP increased OCR (A, B), due to increased aerobic metabolism, and increased ECAR (C, D), due to increased glycolysis consequent to decreased mitochondrial ATP generation, with a net effect of decreased cellular ATP levels (E). ATP level is expressed as % of control, which was the value in cells exposed only to vehicle. The effect on primary cells was similar to that on transformed podocytes. Each data point represents mean ± SD (n = 4), and results are representative of 2 and 3 independent experiments in B and D and in A, C, and E, respectively. *P < 0.05, **P < 0.01 vs. vehicle control, by ANOVA.
Fig. 5.
Fig. 5.
Coupling efficiency and spare respiratory capacity with various energy substrates. A: podocytes were exposed to 1 μM oligomycin, 3 μM FCCP, and 1 μM rotenone. Each data point represents mean ± SE (n = 4), and results are representative of 4 and 3 independent experiments in transformed podocytes and primary podocytes, respectively. Viability of the treated cells remained similar to control by calcein AM stain (data not shown). B: baseline OCR was defined as the average of 4 points of OCR before addition of oligomycin. ATP turnover, proton leak, and mitochondrial respiration were calculated from data obtained (average of 4 points of OCR after injection of oligomycin and average of last 2 points before addition of rotenone) with different energy substrates and were normalized to baseline OCR. C: podocytes were exposed to 1 μM oligomycin, 3 μM FCCP, 1 μM antimycin A, or 1 μM rotenone in glucose + pyruvate assay medium. Each data point represents mean ± SE (n = 5), and results are representative of 3 independent experiments in transformed podocytes. Viability of the treated cells remained similar to control by calcein AM stain (data not shown). D: baseline OCR was defined as the average of 4 points of OCR before addition of oligomycin. ATP turnover, proton leak, and mitochondrial respiration were calculated from data obtained (average of 4 points of OCR after injection of oligomycin and average of last 2 points before addition of antimycin A or rotenone) and were normalized to baseline OCR. E: ECAR was measured in parallel with respiration. Results are normalized to ECAR in glucose medium before addition of oligomycin. Each data point represents mean ± SE (n = 4), and results are representative of 4 independent experiments in transformed podocytes.
Fig. 6.
Fig. 6.
Dose titration of oxamate and 2-DG. Oxamate and 2- DG did not affect OCR (A, B), but each agent increased ECAR (C, D). Oxamate had only a modest effect on cellular ATP levels, while maximal doses of 2-DG (100 mM) decreased cellular ATP levels by ∼25% (E, F); this indicates that podocytes are largely dependent on oxidative phosphorylation rather than glycolysis. ATP level is expressed as % of control, which was the baseline value in cells exposed only to assay medium, *P < 0.05, **P < 0.01 vs. vehicle control, by ANOVA.
Fig. 7.
Fig. 7.
Palmitate as an energy substrate. A: sodium palmitate (200 μM) conjugated with ultra-fatty acid-free bovine serum albumin (BSA) was administered by injection into the assay medium at the time point shown. Oligomycin (1 μM) and FCCP (20 μM) were injected at subsequent time points as shown. OCR was significantly higher with palmitate compared with the control medium (P < 0.001 for area under the curve, by ANOVA). Each data point represents mean ± SE (n = 5), and results are representative of 2 independent experiments. Further, ATP charge was significantly higher with palmitate as an energy source after FCCP administration compared with control (P < 0.001, unpaired t-test), as shown in B. Each data point represents mean ± SD (n = 4), and results are representative of 2 independent experiments.
Fig. 8.
Fig. 8.
Electron and energy flow in mitochondria. Arrows represent the flow of electrons through the respiratory complexes. The generation of mitochondrial membrane potential is either used to generate ATP or dissipated as a proton leak. ROS, reactive oxygen species. Figure is modified from Brookes (2).

References

    1. Brand MD. The efficiency and plasticity of mitochondrial energy transduction. Biochem Soc Trans 33: 897–904, 2005 - PubMed
    1. Brookes PS. Mitochondrial H+ leak and ROS generation: an odd couple. Free Radic Biol Med 38: 12–23, 2005 - PubMed
    1. Choi SW, Gerencser AA, Nicholls DG. Bioenergetic analysis of isolated cerebrocortical nerve terminals on a microgram scale: spare respiratory capacity and stochastic mitochondrial failure. J Neurochem 109: 1179–1191, 2009 - PMC - PubMed
    1. Diomedi-Camassei F, Di Giandomenico S, Santorelli FM, Caridi G, Piemonte F, Montini G, Ghiggeri GM, Murer L, Barisoni L, Pastore A, Muda AO, Valente ML, Bertini E, Emma F. COQ2 nephropathy: a newly described inherited mitochondriopathy with primary renal involvement. J Am Soc Nephrol 18: 2773–2780, 2007 - PubMed
    1. Ganapathy V, Thangaraju M, Gopal E, Martin PM, Itagaki S, Miyauchi S, Prasad PD. Sodium-coupled monocarboxylate transporters in normal tissues and in cancer. AAPS J 10: 193–199, 2008 - PMC - PubMed

Publication types

LinkOut - more resources