

Rapid emergence of protease inhibitor resistance in hepatitis C virus
- PMID: 20445200
- PMCID: PMC3033690
- DOI: 10.1126/scitranslmed.3000544
Rapid emergence of protease inhibitor resistance in hepatitis C virus
Abstract
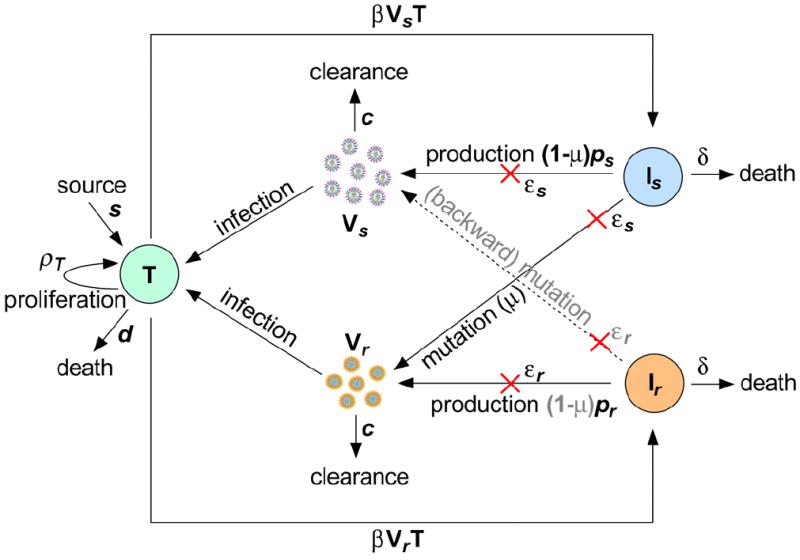
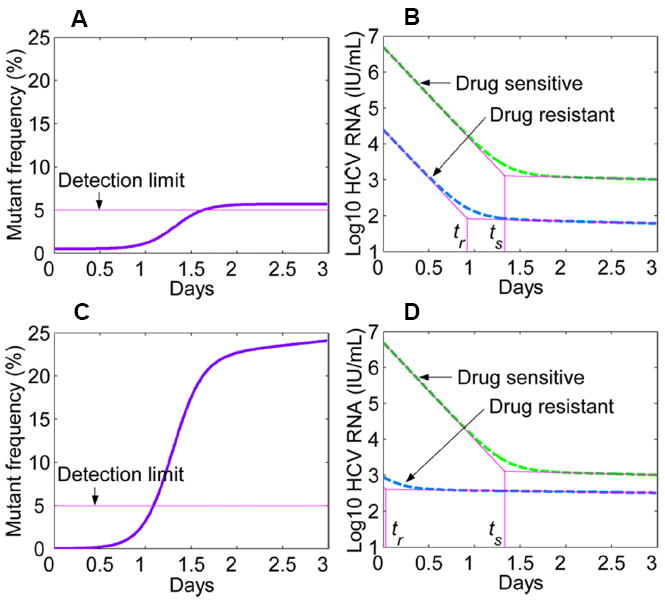
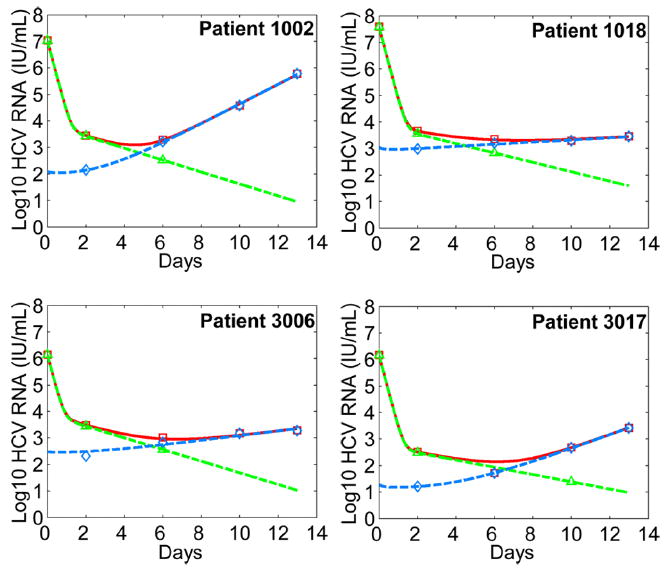
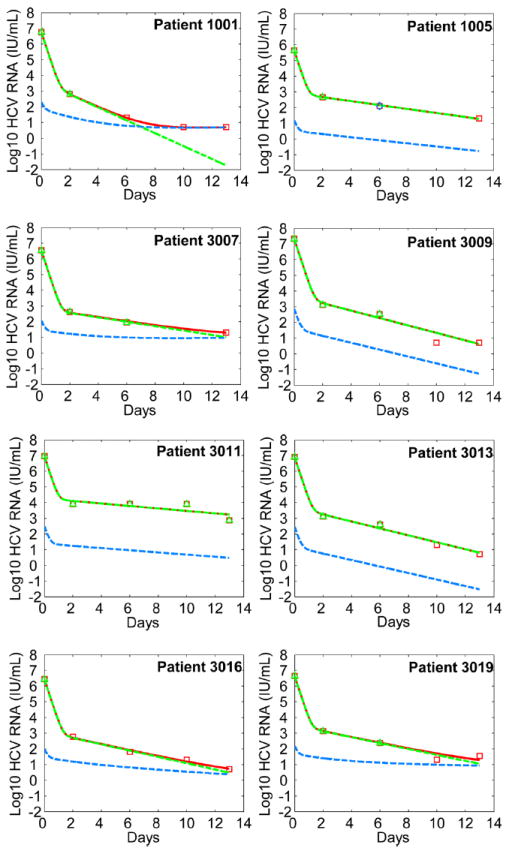
About 170 million people worldwide are infected with hepatitis C virus (HCV). The current standard therapy leads to sustained viral elimination in only approximately 50% of the treated patients. Telaprevir, an HCV protease inhibitor, has substantial antiviral activity in patients with chronic HCV infection. However, in clinical trials, drug-resistant variants emerge at frequencies of 5 to 20% of the total virus population as early as the second day after the beginning of treatment. Here, using probabilistic and viral dynamic models, we show that such rapid emergence of drug resistance is expected. We calculate that all possible single- and double-mutant viruses preexist before treatment and that one additional mutation is expected to arise during therapy. Examining data from a clinical trial of telaprevir therapy for HCV infection in detail, we show that our model fits the observed dynamics of both drug-sensitive and drug-resistant viruses and argue that therapy with only direct antivirals will require drug combinations that have a genetic barrier of four or more mutations.
Conflict of interest statement
Figures
References
-
- Fried MW, et al. Peginterferon alfa-2a plus ribavirin for chronic hepatitis C virus infection. N Engl J Med. 2002;347:975–982. - PubMed
-
- Manns MP, et al. Peginterferon alfa-2b plus ribavirin compared with interferon alfa-2b plus ribavirin for initial treatment of chronic hepatitis C: a randomised trial. Lancet. 2001;358:958–965. - PubMed
-
- De Francesco R, Migliaccio G. Challenges and successes in developing new therapies for hepatitis C. Nature. 2005;436:953–960. - PubMed
-
- Manns MP, et al. The way forward in HCV treatment--finding the right path. Nat Rev Drug Discov. 2007;6:991–1000. - PubMed
-
- Pawlotsky JM, Chevaliez S, McHutchison JG. The hepatitis C virus life cycle as a target for new antiviral therapies. Gastroenterology. 2007;132:1979–1998. - PubMed
Publication types
MeSH terms
Substances
Grants and funding
- R56 AI065256/AI/NIAID NIH HHS/United States
- R37 AI028433/AI/NIAID NIH HHS/United States
- R01 AI028433/AI/NIAID NIH HHS/United States
- R01 RR006555/RR/NCRR NIH HHS/United States
- AI065256/AI/NIAID NIH HHS/United States
- P20-RR18754/RR/NCRR NIH HHS/United States
- P30-EB011339/EB/NIBIB NIH HHS/United States
- R01 AI065256/AI/NIAID NIH HHS/United States
- R01 OD011095/OD/NIH HHS/United States
- RR06555-18/RR/NCRR NIH HHS/United States
- P30 EB011339/EB/NIBIB NIH HHS/United States
- AI28433-19/AI/NIAID NIH HHS/United States
- P20 RR018754/RR/NCRR NIH HHS/United States
LinkOut - more resources
Full Text Sources
Other Literature Sources
