

A comparative study of 11 local health department organizational networks
- PMID: 20445462
- PMCID: PMC3726028
- DOI: 10.1097/PHH.0b013e3181e31cee
A comparative study of 11 local health department organizational networks
Abstract
Context: Although the nation's local health departments (LHDs) share a common mission, variability in administrative structures is a barrier to identifying common, optimal management strategies. There is a gap in understanding what unifying features LHDs share as organizations that could be leveraged systematically for achieving high performance.
Objective: To explore sources of commonality and variability in a range of LHDs by comparing intraorganizational networks.
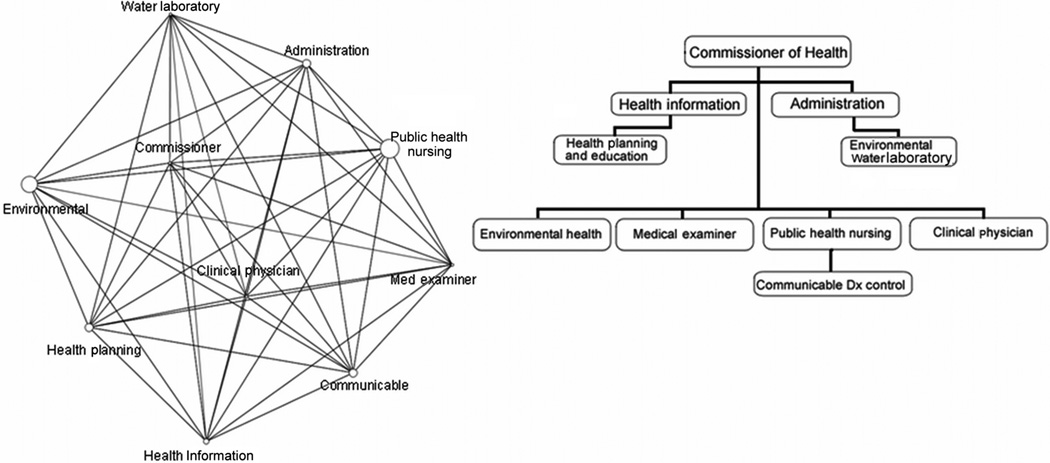
Intervention: We used organizational network analysis to document relationships between employees, tasks, knowledge, and resources within LHDs, which may exist regardless of formal administrative structure.
Setting: A national sample of 11 LHDs from seven states that differed in size, geographic location, and governance.
Participants: Relational network data were collected via an on-line survey of all employees in 11 LHDs. A total of 1062 out of 1239 employees responded (84% response rate).
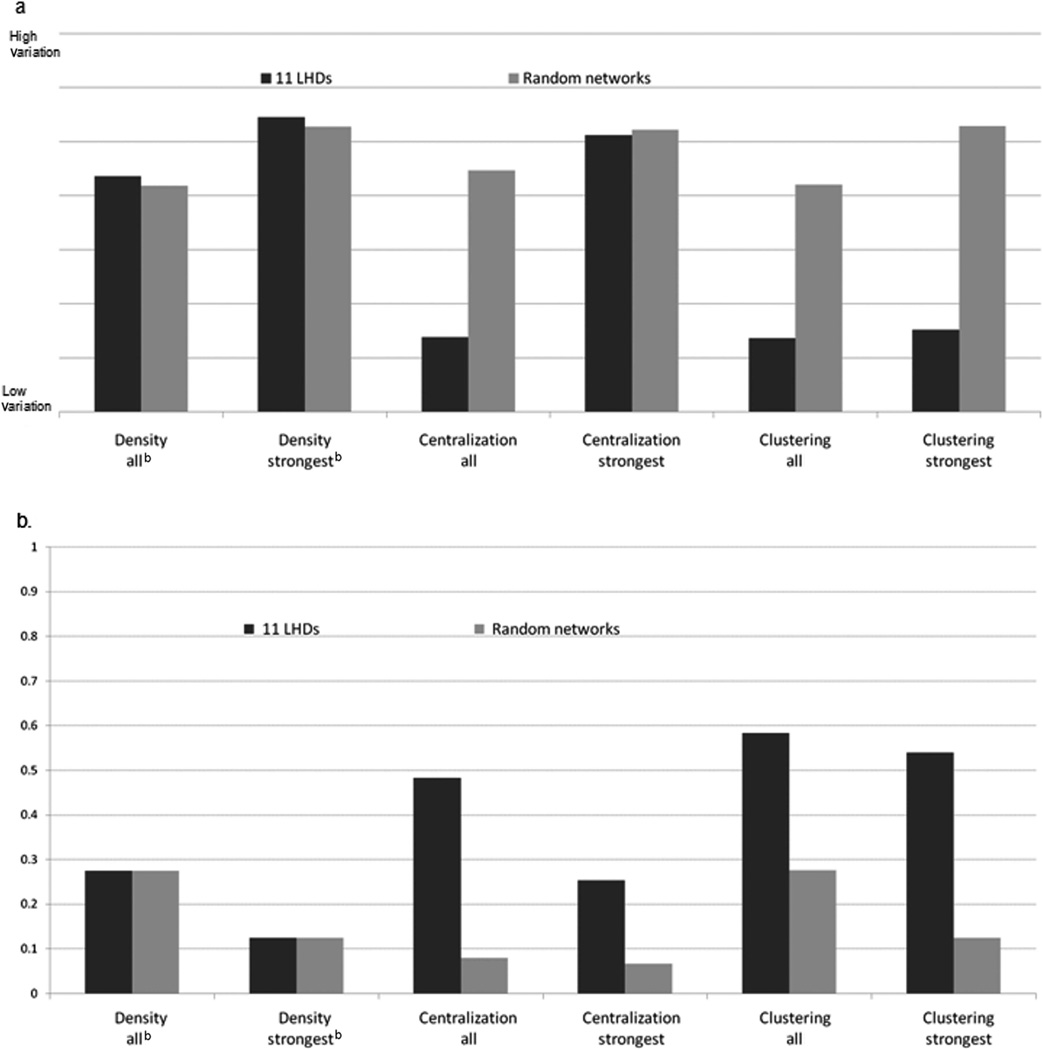
Outcome measures: Network measurements were compared using coefficient of variation. Measurements were correlated with scores from the National Public Health Performance Assessment and with LHD demographics. Rankings of tasks, knowledge, and resources were correlated across pairs of LHDs.
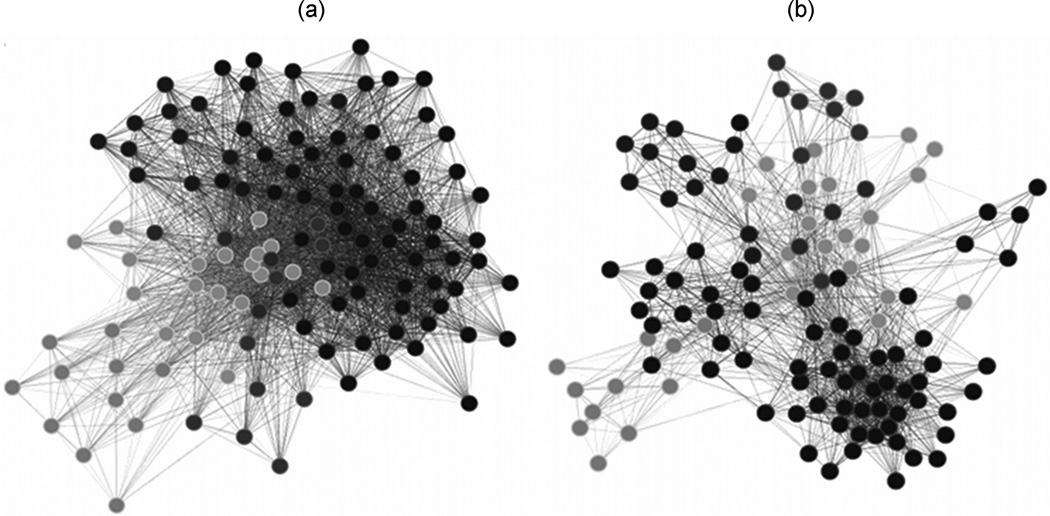
Results: We found that 11 LHDs exhibited compound organizational structures in which centralized hierarchies were coupled with distributed networks at the point of service. Local health departments were distinguished from random networks by a pattern of high centralization and clustering. Network measurements were positively associated with performance for 3 of 10 essential services (r > 0.65). Patterns in the measurements suggest how LHDs adapt to the population served.
Conclusions: Shared network patterns across LHDs suggest where common organizational management strategies are feasible. This evidence supports national efforts to promote uniform standards for service delivery to diverse populations.
Figures
Similar articles
-
The role of a county health department as a linking-pin organization in a network.J Health Hum Serv Adm. 2000 Winter;23(3):324-60. J Health Hum Serv Adm. 2000. PMID: 11924315
-
Is there an association between local health department organizational and administrative factors and childhood immunization coverage rates?J Health Hum Serv Adm. 2012 Spring;34(4):418-55. J Health Hum Serv Adm. 2012. PMID: 22530285
-
The influence of management and environment on local health department organizational structure and adaptation: a longitudinal network analysis.J Public Health Manag Pract. 2013 Nov-Dec;19(6):598-605. doi: 10.1097/PHH.0b013e3182544800. J Public Health Manag Pract. 2013. PMID: 22510786
-
The performance of local health departments: a review of the literature.J Public Health Manag Pract. 2008 Mar-Apr;14(2):E9-18. doi: 10.1097/01.PHH.0000311903.34067.89. J Public Health Manag Pract. 2008. PMID: 18287909 Review.
-
Addressing psychological, mental health and other behavioural healthcare needs of the underserved populations in the United States: the role of local health departments.Perspect Public Health. 2016 Mar;136(2):86-92. doi: 10.1177/1757913915597960. Epub 2015 Aug 28. Perspect Public Health. 2016. PMID: 26318968 Review.
Cited by
-
Multisector Health Policy Networks in 15 Large US Cities.J Public Health Manag Pract. 2016 Nov-Dec;22(6):520-8. doi: 10.1097/PHH.0000000000000401. J Public Health Manag Pract. 2016. PMID: 26910868 Free PMC article.
-
Impact of Economic Constraints on Public Health Delivery Systems Structures.Am J Public Health. 2015 Sep;105(9):e48-53. doi: 10.2105/AJPH.2015.302769. Epub 2015 Jul 16. Am J Public Health. 2015. PMID: 26180988 Free PMC article.
-
Physicians' propensity to collaborate and their attitude towards EBM: a cross-sectional study.BMC Health Serv Res. 2011 Jul 25;11:172. doi: 10.1186/1472-6963-11-172. BMC Health Serv Res. 2011. PMID: 21787395 Free PMC article.
-
The Structure of Policy Networks for Injury and Violence Prevention in 15 US Cities.Public Health Rep. 2017 May/Jun;132(3):381-388. doi: 10.1177/0033354917705367. Epub 2017 Apr 20. Public Health Rep. 2017. PMID: 28426291 Free PMC article.
-
Multi-disciplinary communication networks for skin risk assessment in nursing homes with high IT sophistication.Int J Med Inform. 2014 Aug;83(8):581-91. doi: 10.1016/j.ijmedinf.2014.05.001. Epub 2014 May 21. Int J Med Inform. 2014. PMID: 24915863 Free PMC article.
References
-
- National Association of County & City Health Officials. 2005 National Profile of Local Health Departments. Washington, DC: National Association of County&City Health Officials; 2006.
-
- Scutchfield FD, Bhandari MW, Lawhorn NA, Lamberth CD, Ingram RC. Public health performance. Am J Prev Med. 2009;36(3):266–272. - PubMed
-
- Turnock BJ. Public Health: What It Is and How It Works. 4th ed. Boston, MA: Jones & Bartlett; 2009.
-
- Russo P. Accreditation of public health agencies: a means, not an end. J Public Health Manag Pract. 2007;13(4):329–331. - PubMed
-
- Centers for Disease Control and Prevention. National Public Health Performance Standards program. [Accessed May, 2009]; http://www.cdc.gov/od/ocphp/nphpsp.
Publication types
MeSH terms
Grants and funding
LinkOut - more resources
Full Text Sources
Miscellaneous
