. 2010 Oct;11(7):542-53.
doi: 10.1038/gene.2010.23. Epub 2010 May 6.

Murine lupus susceptibility locus Sle1a requires the expression of two sub-loci to induce inflammatory T cells

Affiliations

Murine lupus susceptibility locus Sle1a requires the expression of two sub-loci to induce inflammatory T cells

C M Cuda et al. Genes Immun. 2010 Oct.

Abstract

The NZM2410-derived Sle1a lupus susceptibility locus induces activated autoreactive CD4(+) T cells and reduces the number and function of Foxp3(+) regulatory T cells (Tregs). In this study, we first showed that Sle1a contributes to autoimmunity by increasing antinuclear antibody production when expressed on either NZB or NZW heterozygous genomes, and by enhancing the chronic graft versus host disease response indicating an expansion of the autoreactive B-cell pool. Screening two non-overlapping recombinants, the Sle1a.1 and Sle1a.2 intervals that cover the entire Sle1a locus, revealed that both Sle1a.1 and Sle1a.2 were necessary for the full Sle1a phenotype. Sle1a.1, and to a lesser extent Sle1a.2, significantly affected CD4(+) T-cell activation as well as Treg differentiation and function. Sle1a.2 also increased the production of autoreactive B cells. As the Sle1a.1 and Sle1a.2 intervals contain only 1 and 15 known genes, respectively, this study considerably reduces the number of candidate genes responsible for the production of autoreactive T cells. These results also show that the Sle1 locus is an excellent model for the genetic architecture of lupus, in which a major obligate phenotype results from the coexpression of multiple genetic variants with individual weak effects.


Conflict of interest statement

Disclosures

The authors have no financial conflict of interest.

Figures

FIGURE 1
FIGURE 1
Sle1a expression increased autoAb production on NZB or NZW heterozygous genomes. Anti-chromatin (A) and anti-dsDNA (B) IgG in 12 month old mice. Time course production of anti-chromatin (C) and anti-dsDNA (D) IgG in (NZB X B6.Sle1a)F1 (black symbols) and (NZW × B6.Sle1a)F1 (white symbols). For E and F, means and standard errors are shown and statistical significance is indicated for t tests between the cohorts at each time point. *: p < 0.05; **: p < 0.01; ***: p < 0.001.
FIGURE 2
FIGURE 2
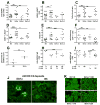
Sle1a or Sle1a.2 expression increased the cGVHD response. Anti-dsDNA IgG (A); spleen weight (B); ratio of AA4.1+ IgM+ CD21lo CD23lo T1 over AA4.1 IgM+ CD21int CD23+ follicular B cells; percentage of CD86+ (D) and CD22 expression (E) in B220+ gated cells; and ratio of CD62L+ CD44 naïve over CD62L CD44+ memory CD4+ T cells five weeks after cGVHD induction in B6, B6.Sle1a and B6.Sle1a sub-congenic mice. G. Additive semi-quantitative scores of glomerular C3 and IgG deposits in B6.Sle1a and B6 mice five weeks after cGVHD induction. H. Anti-dsDNA IgG production in BM chimeras expressing Sle1a in both B and T cells (1a T + 1a B), in T cells only (1a T + B6 B), in B cells only (B6 T + 1a B), or in neither B nor T cells (B6 T + B6 B) one week after cGVHD induction. I. Anti-dsDNA IgG production in BM chimeras grouped according to the Sle1a or B6 origin of their T cells (1a T or B6 T), or B cells (1a B or B6 B). *: p < 0.05; **: p < 0.01; ***: p < 0.001. J. Representative C3 immunofluorescence staining in B6.Sle1a and B6 mice five weeks after cGVHD induction (100x). K. Representative ANA stain and corresponding titer in 9–12 month old mice.
FIGURE 3
FIGURE 3
Map of Sle1a and its two recombinant intervals. From top to bottom are shown: a scale in Mb, the location of the microsatellite markers or SNPs mapping the interval termini, and the Sle1a, Sle1a.1 and Sle1a.2 intervals, in which the black rectangles show the regions of known NZW allelic derivation, and the hatched rectangles on each side indicate the regions of recombination between the NZW and B6 genomes.
FIGURE 4
FIGURE 4
Both Sle1a.1 and Sle1a.2 induced a higher spontaneous proliferation and activation in CD4+ T cells, but only Sle1a.1 was associated with higher ICOS expression. AB. In vivo BrdU incorporation shown in representative FACS plots and their quantitation. C. CD69 expression. D. CD44lo CD62L+ naïve/CD44hi CD62L memory CD4+ ratio. E. ICOS expression. AC shows 2–3 month old mice and DE 8–12 month-old mice. *: p < 0.05; **: p < 0.01.
FIGURE 5
FIGURE 5
Both Sle1a.1 and Sle1a.2 decreased in vitro Treg suppression. AB. Representative FACS plots and quantitation of CD4+ Foxp3+ splenocytes. CD. Representative histograms of CD62L staining in CD4+ CD25+ gated splenocytes and corresponding quantitation. The light gray filled histogram shows the isotype control, the dark gray filled histogram shows B6, while thick, thin and dashed black lines represent B6.Sle1a, B6.Sle1a.1 and B6.Sle1a.2, respectively. E. B6 (black), Sle1a.1 (white) and Sle1a.2 (grey) Treg suppression of B6 Teff proliferation at the indicated ratios in the presence of B6 APCs. For each strain, proliferation in the presence of Treg at various ratios was compared to proliferation in the absence of Tregs. Sle1a.1 (F) or Sle1a.2 (G) expression in Tregs, Teffs, or APCs affects the extent of the inhibition of Teff proliferation. The inhibition of Teff proliferation in presence of 1:1, 1:4, or 1:16 Treg:Teff ratios is expressed as a percentage of the proliferation induced in the absence of Tregs for each condition. Data were collected from 5–7 month old mice. E–G graphs are representative of 2 independent assays each with 3–4 mice per strain. All comparisons were performed with B6 values. *: p<0.05, **: p<0.01, ***: p<0.001.
FIGURE 6
FIGURE 6
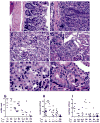
Sle1a Tregs and Teffs induce colon and renal inflammatory infiltrates. A. Colon from a B6.Rag mouse reconstituted with B6 Teff: B6 Treg, which is indistinguishable from unmanipulated B6. Lumen is toward the right of figure and the arrow head marks muscularis mucosa. B. High grade colitis in a mouse reconstituted with Sle1a Teff alone. Arrow head points to muscularis mucosa as in A. The wall is markedly expanded with lymphocytic cryptitis (thin arrow), inflammation of the lamina propria with occasional giant cells (upper right, asterisk), inflammation of the muscularis mucosa, and interstitial submucosa on left of picture. C. Kidney cortex from a B6.Rag mouse reconstituted with B6 Teff: B6 Treg, which is indistinguishable from unmanipulated B6. D. Kidney from a mouse reconstituted with Sle1a Teff alone, with a moderate size focus of interstitial inflammation (center between glomerulus and vein in upper center). Epithelioid giant cell (asterisk) is shown in set (1000x magnification). E. Normal tubules a mouse reconstituted with B6 Teff: B6 Treg, with open round nuclei in epithelial cells and peritubular capillary (arrowhead). F. Tubules from same animal as in D, showing tubulitis with lymphocytic infiltration containing dark, dense oval nuclei (arrows and others) and capillaritis in peritubular capillaries congested with lymphocytes (between tubules with arrows). Dilated but otherwise empty capillaries are also present (e.g. arrowhead). AD. 400x original magnification, EF. 1000x original magnification. AB. H&E stain; CF. PAS stain. G. Histological assessment of colitis ranked among the 6 groups with Teffs:Tregs of mixed origin. **: p<0.01 indicate the significance of comparisons with the B6:B6 group in a Dunnett’s Multiple Comparison Test. ##: p < 0.0004, t test between Sle1a1 Tregs:B6 Teffs and B6 Tregs:Sle1a.1 Teffs. H. Number of renal foci induced by Teffs as compared to controls B6:B6. The values of Teffs alone are significantly higher than that of B6:B6 for all strains. **: p<0.01 indicate the significance of the comparison between B6 and Sle1a Teffs. I. Number of renal foci induced Teffs:Tregs of mixed origin *: p<0.05, **: p<0.01 indicate the significance of comparisons with the B6:B6 group in a Dunnett’s Multiple Comparison Test.
FIGURE 7
FIGURE 7
Expression of either Sle1a.1 or Sle1a.2 affects CD4+ functions in a cell-intrinsic manner. B6 hosts were reconstituted with B6.Thy1a and/or B6.Sle1a sub-loci (Thy1b allele) BM. Connected symbols indicate values for CD4+ T cells expressing the Thy1a (CD90.1-gated) or Thy1b (CD90.2-gated) alleles within the same mouse. Controls are represented by B6.Thy1a → B6 and B6.Sle1a.1 or B6.Sle1a.2→ B6 single-strain BM transfers. A. Percentage of CD4+ CD69+ splenocytes after stimulation with anti-CD3 and anti-CD28 for 12 h. B. Percentage of CD4+ CD25+ CD62L+ Treg splenocytes. Representative histograms showing CD69 and CD62L expression for Sle1a.1 chimeras are shown on the right. Two-tailed paired t tests: *: p<0.05, **: p<0.01, ***: p<0.001.

References

    1. Wakeland EK, Liu K, Graham RR, Behrens TW. Delineating the genetic basis of systemic lupus erythematosus. Immunity. 2001;15:397–408. - PubMed
    1. Kono DH, Theofilopoulos AN. Genetics of SLE in mice. Springer Semin Immunopathol. 2006;28:83–96. - PubMed
    1. Morel L, Rudofsky UH, Longmate JA, Schiffenbauer J, Wakeland EK. Polygenic control of susceptibility to murine systemic lupus erythematosus. Immunity. 1994;1:219–229. - PubMed
    1. Waters ST, Fu SM, Gaskin F, Deshmukh US, Sung SSJ, Kannapell CC, et al. NZM2328: A new mouse model of systemic lupus erythematosus with unique genetic susceptibility loci. Clin Immunol. 2001;100:372–383. - PubMed
    1. Vyse TJ, Rozzo SJ, Drake CG, Izui S, Kotzin BL. Control of multiple autoantibodies linked with a lupus nephritis susceptibility locus in New Zealand Black mice. J Immunol. 1997;158:5566–5574. - PubMed

Publication types

MeSH terms