. 2010 Jun;6(2):191-201.
doi: 10.1007/s11306-010-0207-x. Epub 2010 Apr 1.

Lipidomic analysis of variation in response to simvastatin in the Cholesterol and Pharmacogenetics Study

Lipidomic analysis of variation in response to simvastatin in the Cholesterol and Pharmacogenetics Study

Rima Kaddurah-Daouk et al. Metabolomics. 2010 Jun.

Abstract

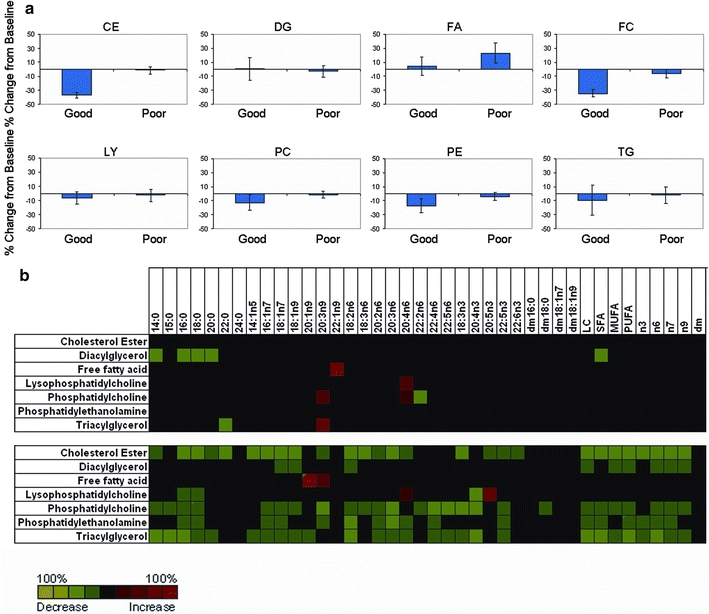
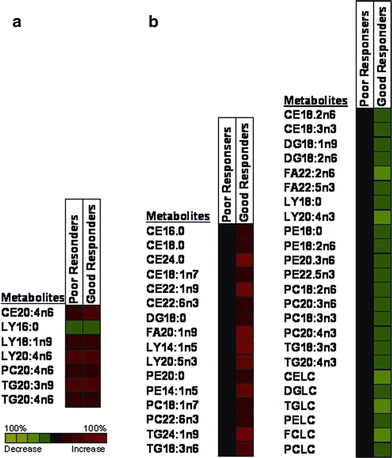
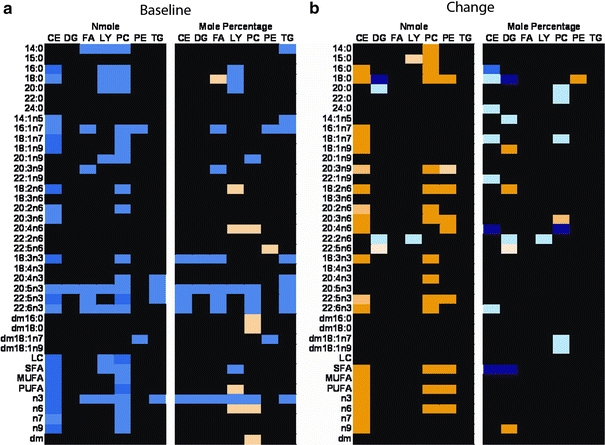
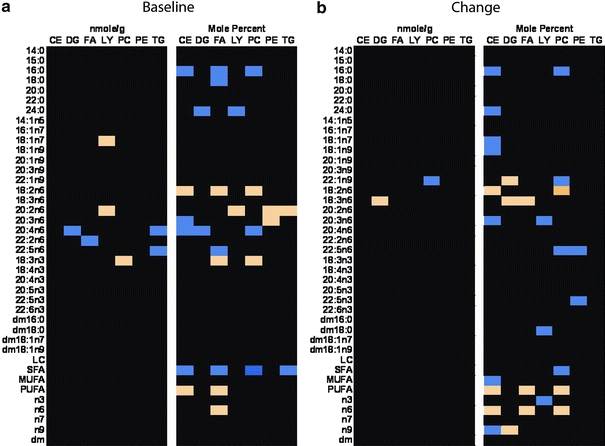
Statins are commonly used for reducing cardiovascular disease risk but therapeutic benefit and reductions in levels of low-density lipoprotein cholesterol (LDL-C) vary among individuals. Other effects, including reductions in C-reactive protein (CRP), also contribute to treatment response. Metabolomics provides powerful tools to map pathways implicated in variation in response to statin treatment. This could lead to mechanistic hypotheses that provide insight into the underlying basis for individual variation in drug response. Using a targeted lipidomics platform, we defined lipid changes in blood samples from the upper and lower tails of the LDL-C response distribution in the Cholesterol and Pharmacogenetics study. Metabolic changes in responders are more comprehensive than those seen in non-responders. Baseline cholesterol ester and phospholipid metabolites correlated with LDL-C response to treatment. CRP response to therapy correlated with baseline plasmalogens, lipids involved in inflammation. There was no overlap of lipids whose changes correlated with LDL-C or CRP responses to simvastatin suggesting that distinct metabolic pathways govern statin effects on these two biomarkers. Metabolic signatures could provide insights about variability in response and mechanisms of action of statins. ELECTRONIC SUPPLEMENTARY MATERIAL: The online version of this article (doi:10.1007/s11306-010-0207-x) contains supplementary material, which is available to authorized users.


Figures

Fig. 1
Fig. 1
Changes in effect of simvastatin treatment on lipid classes post-treatment in good and poor responders with simvastatin response defined as change in LDL-C. a Data is mean and standard deviation of the percent difference in each lipid class post-treatment. b Heat map showing quantitative changes (nmol/g) in lipids post-treatment with simvastatin in poor responders, (top) and in good responders (bottom). The column headers indicate fatty acid metabolites as they appear in each distinct lipid class (rows). Lipids whose percent levels were significantly (P ≤ 0.05) higher post- versus pre-treatment are shown in red while those with significantly (P ≤ 0.05) decreased level are shown in green with the brightness of each color corresponded to the magnitude of the difference in quartiles with the brighter the square, the larger the difference
Fig. 2
Fig. 2
Heat maps showing compositional changes within lipid classes (mole percentage changes) post-treatment with simvastatin. a Data were sorted to select metabolites that were significantly (P ≤ 0.05) changed pre- to post-treatment in the same direction for both good and poor responders. b Data were sorted to select metabolites that were significantly (P ≤ 0.05) changed pre- to post-treatment in good responders only. Metabolite changes are listed on the right. Lipids whose percent levels were higher post- versus pre-treatment are shown in red while those with decreased level are shown in green; see Sect. 2 for details with the brightness of each color corresponded to the magnitude of the difference in quartiles with the brighter the square, the larger the difference
Fig. 3
Fig. 3
Correlation between LDL-C and metabolite concentration and composition. Heatmaps show significant (P ≤ 0.05) metabolite correlations with LDL-C concentration at baseline and post-treatment with simvastatin treatment. Fatty acids are listed on the left side of each heat map with lipid classes listed across the top. Each square represents a correlation between the metabolite and LDL-C. a Baseline metabolite concentrations (nmol/g, left side) or mole percentages (right side) correlated with baseline LDL-C concentration, b Change in metabolite concentrations (nmol/g, left side) or lipid composition (mole percentage changes right side) pre- to post-treatment correlated with LDL-C response to treatment. Blue is a positive correlation and yellow is a negative correlation. The darkness of each color corresponds to the magnitude of the difference in quartiles of the Spearman correlation coefficient with the darker the square, the larger the difference
Fig. 4
Fig. 4
Baseline metabolites which correlate with LDL-C or CRP response to treatment. Sorted heat maps showing metabolite concentration (nmol/g) (a) or (b) lipid composition within classes (mole percentage) b that are predictive of changes in LDL-C or CRP (P ≤ 0.05). Metabolites are listed on the left side of each sorted heat map. Each square represents a correlation between the metabolite and LDL-C or CRP. Blue is positive and yellow is negative correlation. The darkness of each color corresponds to the magnitude of the difference in quartiles of the Spearman correlation coefficient with the darker the square, the larger the difference
Fig. 5
Fig. 5
Correlations between CRP and metabolite concentration and composition. Heat maps show significant (P ≤ 0.05) metabolite correlations with CRP concentration. Fatty acids are listed on the left side of each heat map with lipid classes listed across the top. Each square represents a correlation between the metabolite and CRP. a Baseline metabolite concentrations (nmol/g, left side) or mole percentages (right side) correlated with baseline CRP, b Change in metabolite concentrations (nmol/g, left side) or mole percentages (right side) pre- to post-treatment correlated with CRP response to treatment. Blue is a positive correlation and yellow is a negative correlation. The darkness of each color corresponds to the magnitude of the difference in quartiles of the Spearman correlation coefficient with the darker the square, the larger the difference
Fig. 6
Fig. 6
Metabolic pathway changes with simvastatin treatment in subjects segregated by response to LDL-C. Ratios of precursor/products in TG and PC lipid metabolites were used to estimate changes in the metabolic pathways for biosynthesis of n6 fatty acids pre- to post-treatment with simvastatin in good and poor responders. The enzyme activities were estimated utilizing the product/precursor ratio as described in the Sect. 2. Ratios which were significantly (P ≤ 0.05) higher post- versus pre-treatment are shown in red while those significantly (P ≤ 0.05) decreased are shown in green

References

    1. AHA. (2004). Heart disease and stroke statistics––2004 update. Dalls, TX: American Heart Association.
    1. Baigent C, Keech A, Kearney PM, Blackwell L, Buck G, Pollicino C, Kirby A, Sourjina T, Peto R, Collins R, Simes R. Efficacy and safety of cholesterol-lowering treatment: prospective meta-analysis of data from 90, 056 participants in 14 randomised trials of statins. Lancet. 2005;366:1267–1278. doi: 10.1016/S0140-6736(05)67394-1. - DOI - PubMed
    1. Bilheimer DW, Grundy SM, Brown MS, Goldstein JL. Mevinolin stimulates receptor-mediated clearance of low density lipoprotein from plasma in familial hypercholesterolemia heterozygotes. Transactions of the Association of American Physicians. 1983;96:1–9. - PubMed
    1. Bonnet J, Mcpherson R, Tedgui A, Simoneau D, Nozza A, Martineau P, Davignon J. Comparative effects of 10-mg versus 80-mg Atorvastatin on high-sensitivity C-reactive protein in patients with stable coronary artery disease: results of the CAP (comparative atorvastatin pleiotropic effects) study. Clinical Therapeutics. 2008;30:2298–2313. doi: 10.1016/j.clinthera.2008.12.023. - DOI - PubMed
    1. Cipollone F, Fazia M, Iezzi A, Zucchelli M, Pini B, De Cesare D, Ucchino S, Spigonardo F, Bajocchi G, Bei R, Muraro R, Artese L, Piattelli A, Chiarelli F, Cuccurullo F, Mezzetti A. Suppression of the functionally coupled cyclooxygenase-2/prostaglandin E synthase as a basis of simvastatin-dependent plaque stabilization in humans. Circulation. 2003;107:1479–1485. doi: 10.1161/01.CIR.0000056530.03783.81. - DOI - PubMed

LinkOut - more resources