. 2010 Aug;56(4):321-40.
doi: 10.1007/s00294-010-0302-6. Epub 2010 May 6.

The distribution of inverted repeat sequences in the Saccharomyces cerevisiae genome

Affiliations

The distribution of inverted repeat sequences in the Saccharomyces cerevisiae genome

Eva M Strawbridge et al. Curr Genet. 2010 Aug.

Abstract

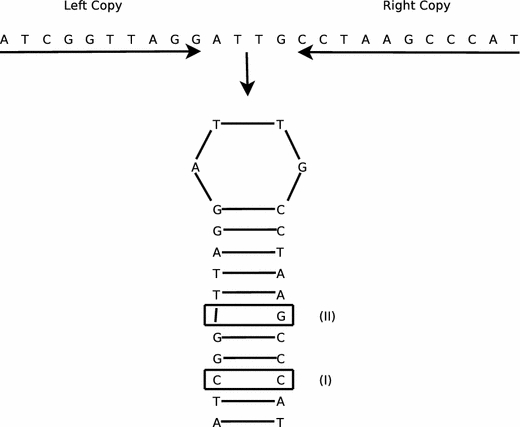
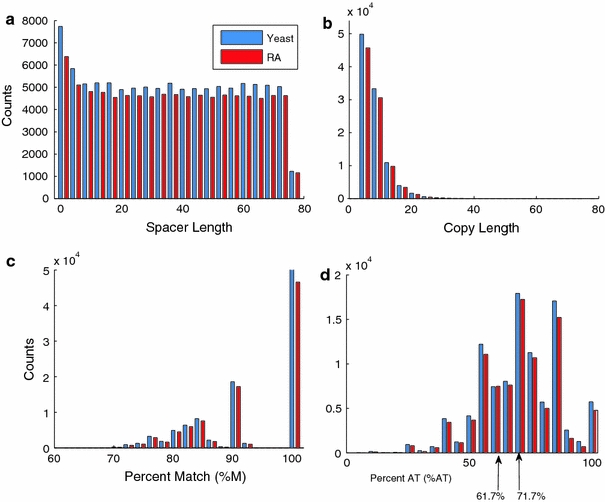
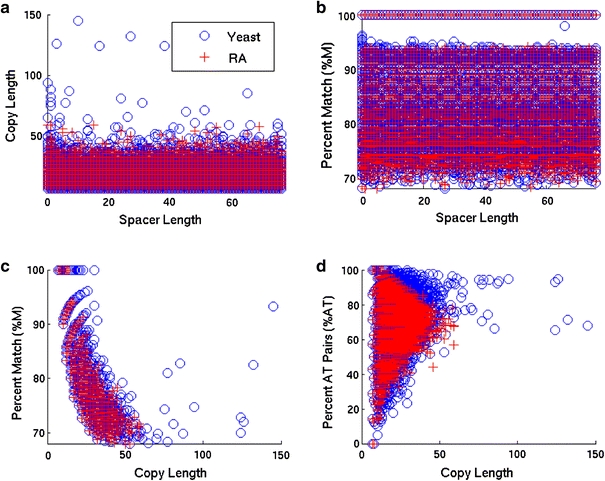
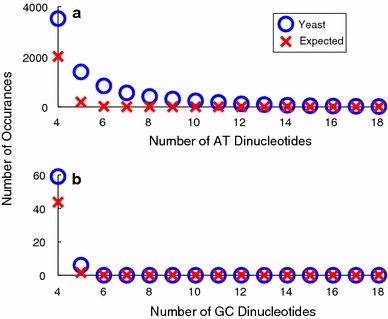
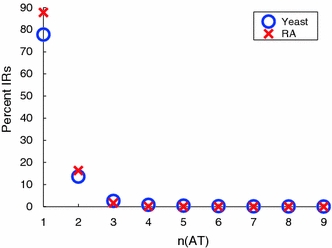
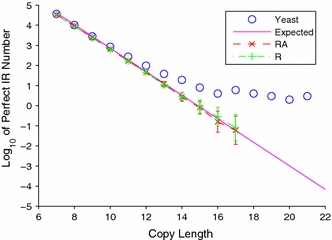
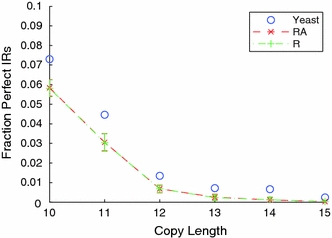
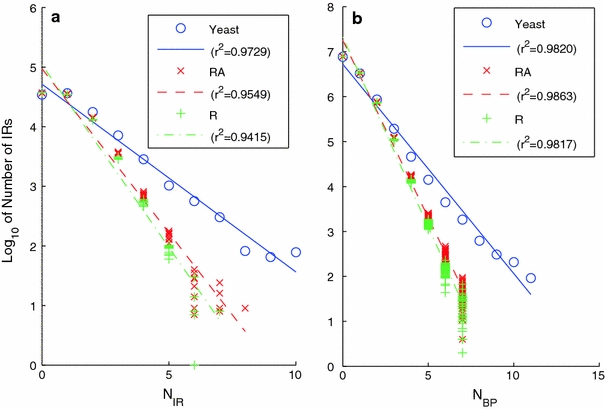
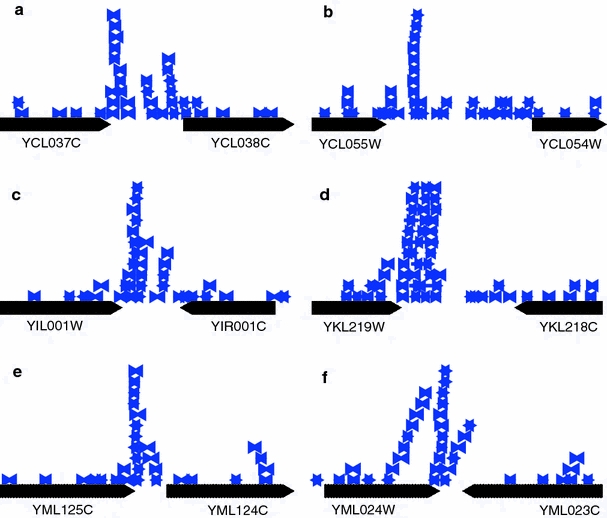
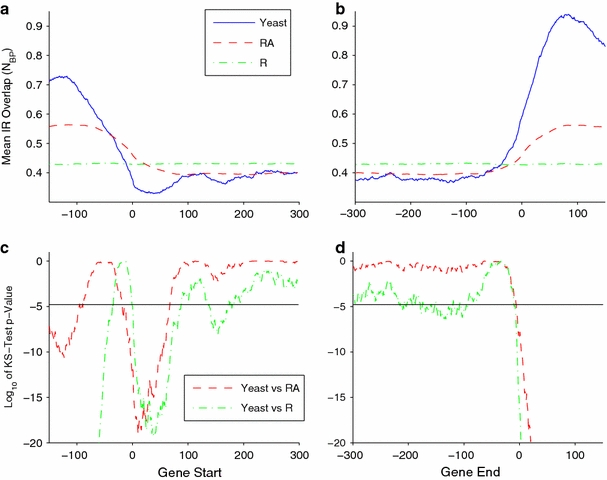
Although a variety of possible functions have been proposed for inverted repeat sequences (IRs), it is not known which of them might occur in vivo. We investigate this question by assessing the distributions and properties of IRs in the Saccharomyces cerevisiae (SC) genome. Using the IRFinder algorithm we detect 100,514 IRs having copy length greater than 6 bp and spacer length less than 77 bp. To assess statistical significance we also determine the IR distributions in two types of randomization of the S. cerevisiae genome. We find that the S. cerevisiae genome is significantly enriched in IRs relative to random. The S. cerevisiae IRs are significantly longer and contain fewer imperfections than those from the randomized genomes, suggesting that processes to lengthen and/or correct errors in IRs may be operative in vivo. The S. cerevisiae IRs are highly clustered in intergenic regions, while their occurrence in coding sequences is consistent with random. Clustering is stronger in the 3' flanks of genes than in their 5' flanks. However, the S. cerevisiae genome is not enriched in those IRs that would extrude cruciforms, suggesting that this is not a common event. Various explanations for these results are considered.


Figures

Fig. 1
Fig. 1
An imperfect inverted repeat and its hairpin structure. The hairpin has nine matched base pairs, one mismatch at site I, and one indel (an insertion in the right copy or a deletion in the left copy) at site II
Fig. 2
Fig. 2
The distribution of four inherent features—spacer length (a), copy length (b), percent match (c), and percent A+T (d)—of the full set of IRs found in this study. Values for the 100,514 IRs found in the S. cerevisiae genome are indicated in blue, while those for a representative RA genome are in red. In part (d) we indicate by arrows the S. cerevisiae genomic A+T content (61.7%) and the average A+T content of the S. cerevisiae IR set (71.7%)
Fig. 3
Fig. 3
The correlations are shown between pairs of inherent IR features in the S. cerevisiae genome (blue) and in a representative RA (randomized) genome (red). No correlation is found between spacer length and either copy length (a) or percent match (b) in either case. The strong negative correlation between percent match and copy length seen in (c) results from the scoring scheme of the IRFinder algorithm, which allows more imperfections in longer IRs. A very weak correlation exists between percent AT and copy length (d)
Fig. 4
Fig. 4
The numbers of ApT and TpA dinucleotide repeats in the S. cerevisiae genome are shown in part a as a function of repeat length. Part b shows the corresponding data for GpC and CpG dinucleotides. Here, the S. cerevisiae genome is represented by blue circles while the average numbers in the RA randomizations are shown as red x’s
Fig. 5
Fig. 5
The percentage of IRs in the S. cerevisiae genome (blue circles) and in a representative RA genome (red x’s) that contain one or more ApT or TpA dinucleotide repeat of length n, for n ≥ 1
Fig. 6
Fig. 6
The number of perfect inverted repeats is plotted as a function of copy length in semilog coordinates. The data for the S. cerevisiae genome are shown in blue, while the means for the R- and the RA-randomizations are shown in green and red, respectively, with error bars corresponding to one standard deviation. The theoretically calculated expected numbers for a genome the base composition of which is 40% C+G are shown in magenta. The S. cerevisiae genome is significantly enriched in perfect inverted repeats for every copy length
Fig. 7
Fig. 7
The fraction of perfect inverted repeats are shown for the S. cerevisiae (blue), RA (red), and R (green) genomes, respectively. The error bars here represent two standard deviations about the mean. The S. cerevisiae genome has a significantly greater proportion of perfect inverted repeats than either randomization. Because the scoring scheme of the IRF search algorithm only allows imperfections in IRs longer than 9 bp, the data are confined to this region
Fig. 8
Fig. 8
Part a shows the number of inverted repeats that are overlapped by N IR others, together with regression lines, plotted for the S. cerevisiae (blue), RA (red), and R (green) genomes. Part b shows the number N bp of distinct inverted repeats that overlap a given base pair. Both plots are presented in semilog coordinates. There is significant clustering of IRs in the S. cerevisiae genome relative to random, as shown by the larger overlap numbers it attains
Fig. 9
Fig. 9
The six regions of the S. cerevisiae genome are shown where the highest levels of IR overlap are attained. Here IRs are represented by blue arrows, one arrow for each copy, pointing toward the center of symmetry. The flanking genes are shown in black with the arrow indicating transcriptional direction. Regions (ab), (c), (d), (ef) are located on chromosomes 3, 9, 11, and 13 respectively
Fig. 10
Fig. 10
The mean overlap number N bp is shown for 3,832 genes aligned at their start (a), and stop positions (b). The results for the S. cerevisiae genome are shown in blue, while those for the RA- and R-genomes are in red and green, respectively. We compared the distributions at each position using the Kolmogorov–Smirnov test. The p values assessing statistical significance found this way at each position are plotted logarithmically in parts (c) and (d). The threshold for significance is shown as a horizontal line in each case. We note that significance can occur through either enrichment or paucity relative to random. This shows a significant enrichment of IRs in the 5′ and 3′ flanks of genes, with greater enrichment in the downstream, 3′ flanks. Within coding regions IRs occur at rates consistent with random, given their base composition. Within the first 80 bp after the gene start there are significantly fewer IRs than expected at random

Similar articles

Cited by

References

    1. Achaz G, Coissac E, Netter P, Rocha EPC. Associations between inverted repeats and the structural evolution of bacterial genomes. Genetics. 2003;164:1279–1289. - PMC - PubMed
    1. Achez G, Coissac E, Viari A, Netter P. Analysis of intrachromosomal duplications in yeast Saccharomyces cerevisiae: a possible model for their origin. Mol Biol Evol. 2000;17:1268–1275. - PubMed
    1. Akgun E, Zahn J, Baumes S, Brown G, Liang F, Romanienko PJ, Lewis S, Jasin M. Palindrome resolution and recombination in the mammalian germ line. Mol Cell Biol. 1997;17:5559–5570. - PMC - PubMed
    1. Alvarez D, Novac O, Callejo M, Ruiz MT, Price GB, Zannis-Hadjopoulos M. 14-3-3 sigma is a cruciform DNA binding protein and associates in vivo with origins of DNA replication. J Cell Biochem. 2002;87:194–207. doi: 10.1002/jcb.10294. - DOI - PubMed
    1. Bauer WR, Benham CJ. The free energy, enthalpy and entropy of native and of partially denatured closed circular DNA. J Mol Biol. 1993;234:1184–1196. doi: 10.1006/jmbi.1993.1669. - DOI - PubMed

Publication types