. 2010 Oct;19(10):1557-70.
doi: 10.1089/scd.2009.0445.

Prospective identification and skeletal localization of cells capable of multilineage differentiation in vivo

Affiliations

Prospective identification and skeletal localization of cells capable of multilineage differentiation in vivo

Russell S Taichman et al. Stem Cells Dev. 2010 Oct.

Abstract

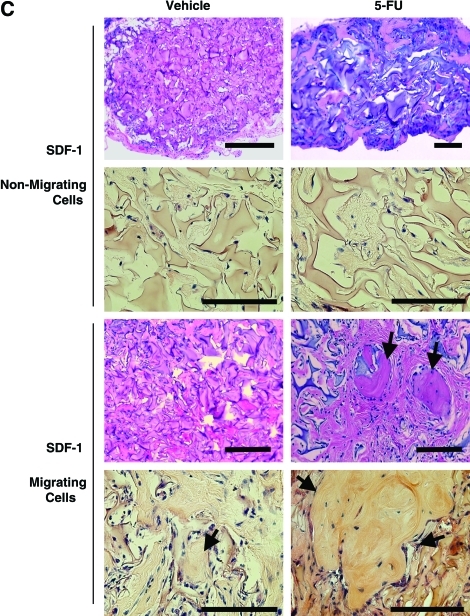
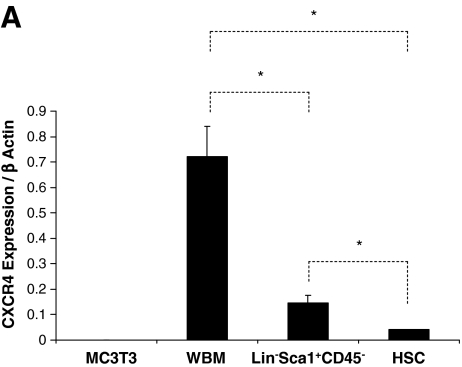
A prospective in vivo assay was used to identify cells with potential for multiple lineage differentiation. With this assay, it was first determined that the 5-fluorouracil resistant cells capable of osseous tissue formation in vivo also migrated toward stromal derived factor-1 (SDF-1) in vitro. In parallel, an isolation method based on fluorescence-activated cell sorting was employed to identify a very small cell embryonic-like Lin-/Sca-1+CD45- cell that with as few as 500 cells was capable of forming bone-like structures in vivo. Differential marrow fractionation studies determined that the majority of the Lin-Sca-1+CD45- cells reside in the subendosteal regions of marrow. To determine whether these cells were capable of differentiating into multiple lineages, stromal cells harvested from Col2.3 Delta TK mice were implanted with a gelatin sponge into SCID mice to generate thymidine kinase sensitive ossicles. At 1.5 months, 2,000 green fluorescent protein (GFP)+ Lin-Sca-1+CD45- cells were injected into the ossicles. At harvest, colocalization of GFP-expressing cells with antibodies to the osteoblast-specific marker Runx-2 and the adipocyte marker PPAP gamma were observed. Based on the ability of the noncultured cells to differentiate into multiple mesenchymal lineages in vivo and the ability to generate osseous tissues at low density, we propose that this population fulfills many of the characteristics of mesenchymal stem cells.


Figures

FIG. 1.
FIG. 1.
Stromal derived factor-1 (SDF-1) responsive marrow cells recovered from 5-fluorouracil (5-FU) treated animals form discrete bone tissues in vivo. (A) Migration assay of vehicle or 5-FU or in vivo treated marrow cells in response to SDF-1. Bone marrow cells were harvested from Balb/c mice treated in vivo 5 days earlier with vehicle or 5-FU. In vitro, 1 × 106 cells were placed in the top chamber of chemotactic wells in the presence (SDF-1) or absence (control) of 200 ng/mL SDF-1 in the bottom chamber. After 4 h, the cells that had migrated into the bottom chamber of the chemotactic TransWell plates were quantified. Significantly more cells from both the in vivo vehicle and 5-FU treated animals migrated in response to SDF-1. *P < 0.05. (B) mRNA expression of CXCR4 by marrow cells recovered from vehicle or 5-FU treated animals that had migrated into the bottom chambers of chemotactic TransWell plates in response to SDF-1. As in (A), marrow cells were recovered from in vivo vehicle or 5-FU treated animals. After in vitro migration assays in dual chambered plates, the migrating cells were recovered and prepared for real-time reverse-transcriptase polymerase chain reaction (PCR) determination of CXCR4 mRNA levels. As controls, in some cases whole bone marrow (WBM) cells were placed into the upper chambers with no chemoattractant in the bottom chamber. At the conclusion of the assays, the cells were recovered from the top chamber and prepared for mRNA analyses by real-time reverse transcriptase (RT)-PCR. CXCR4 mRNA levels were normalized to β-actin levels. *P < 0.05. (C) Histology of tissues generated by SDF-1-migrating marrow cells (50,000 cells) recovered from 5-FU treated animals. As in (A), bone marrow cells were harvested from Balb/c mice and treated in vivo with 5-FU. Recovered WBM cells were placed in the top chamber of chemotactic apparatus with 200 ng/mL SDF-1 in the bottom chamber. After 4 h, the SDF-1-migrating (recovered from the bottom chambers) and nonmigrating cells (top chambers) were collected, counted, and 50,000 cells/implant were loaded in gelatin sponges and implanted into SCID mice. After 5 weeks, the implants were harvested, imaged by microcomputed tomography (μCT), and sectioned for histology [hematoxylin and eosin (H&E)]. The data demonstrate that cells isolated from animals treated with 5-FU which migrated in response to SDF-1 formed discrete bone tissues in vivo. Arrows depict a typical bone foci, H&E staining, 100 ×; Bar = 50 μm. (D) μCT analysis for bone mineral density (BMD). μCT analysis of tissues generated by SDF-1-migrating marrow cells (50,000 cells) recovered from 5-FU treated animals. As in (A), bone marrow cells were harvested from Balb/c mice and treated in vivo with 5-FU. Recovered WBM cells were placed in the top chamber of chemotactic apparatus with 200 ng/mL SDF-1 in the bottom chamber. After 4 h, the SDF-1-migrating (recovered from the bottom chambers) and nonmigrating cells (top chambers) were collected, counted, and 50,000 cells/implant were loaded in gelatin sponges and implanted into SCID mice. After 5 weeks, the implants were harvested, imaged by μCT. The data demonstrate that marrow cells isolated from 5-FU treated mice which had migrated in response to SDF-1 produced tissues that were most significantly mineralized. *Significant differences from control at P < 0.01. Color images available online at www.liebertonline.com/scd.
FIG. 1.
FIG. 1.
Stromal derived factor-1 (SDF-1) responsive marrow cells recovered from 5-fluorouracil (5-FU) treated animals form discrete bone tissues in vivo. (A) Migration assay of vehicle or 5-FU or in vivo treated marrow cells in response to SDF-1. Bone marrow cells were harvested from Balb/c mice treated in vivo 5 days earlier with vehicle or 5-FU. In vitro, 1 × 106 cells were placed in the top chamber of chemotactic wells in the presence (SDF-1) or absence (control) of 200 ng/mL SDF-1 in the bottom chamber. After 4 h, the cells that had migrated into the bottom chamber of the chemotactic TransWell plates were quantified. Significantly more cells from both the in vivo vehicle and 5-FU treated animals migrated in response to SDF-1. *P < 0.05. (B) mRNA expression of CXCR4 by marrow cells recovered from vehicle or 5-FU treated animals that had migrated into the bottom chambers of chemotactic TransWell plates in response to SDF-1. As in (A), marrow cells were recovered from in vivo vehicle or 5-FU treated animals. After in vitro migration assays in dual chambered plates, the migrating cells were recovered and prepared for real-time reverse-transcriptase polymerase chain reaction (PCR) determination of CXCR4 mRNA levels. As controls, in some cases whole bone marrow (WBM) cells were placed into the upper chambers with no chemoattractant in the bottom chamber. At the conclusion of the assays, the cells were recovered from the top chamber and prepared for mRNA analyses by real-time reverse transcriptase (RT)-PCR. CXCR4 mRNA levels were normalized to β-actin levels. *P < 0.05. (C) Histology of tissues generated by SDF-1-migrating marrow cells (50,000 cells) recovered from 5-FU treated animals. As in (A), bone marrow cells were harvested from Balb/c mice and treated in vivo with 5-FU. Recovered WBM cells were placed in the top chamber of chemotactic apparatus with 200 ng/mL SDF-1 in the bottom chamber. After 4 h, the SDF-1-migrating (recovered from the bottom chambers) and nonmigrating cells (top chambers) were collected, counted, and 50,000 cells/implant were loaded in gelatin sponges and implanted into SCID mice. After 5 weeks, the implants were harvested, imaged by microcomputed tomography (μCT), and sectioned for histology [hematoxylin and eosin (H&E)]. The data demonstrate that cells isolated from animals treated with 5-FU which migrated in response to SDF-1 formed discrete bone tissues in vivo. Arrows depict a typical bone foci, H&E staining, 100 ×; Bar = 50 μm. (D) μCT analysis for bone mineral density (BMD). μCT analysis of tissues generated by SDF-1-migrating marrow cells (50,000 cells) recovered from 5-FU treated animals. As in (A), bone marrow cells were harvested from Balb/c mice and treated in vivo with 5-FU. Recovered WBM cells were placed in the top chamber of chemotactic apparatus with 200 ng/mL SDF-1 in the bottom chamber. After 4 h, the SDF-1-migrating (recovered from the bottom chambers) and nonmigrating cells (top chambers) were collected, counted, and 50,000 cells/implant were loaded in gelatin sponges and implanted into SCID mice. After 5 weeks, the implants were harvested, imaged by μCT. The data demonstrate that marrow cells isolated from 5-FU treated mice which had migrated in response to SDF-1 produced tissues that were most significantly mineralized. *Significant differences from control at P < 0.01. Color images available online at www.liebertonline.com/scd.
FIG. 2.
FIG. 2.
CXCR4 expression and SDF-1 responsiveness of LinSca1+CD45 cells. (A) Expression of CXCR4 mRNA CXCR4 by LinSca1+CD45 cells as determined by quantitative RT-PCR (QRT-PCR). Freshly isolated LinSca1+CD45 very small embryonic-like (VSEL) cells, hematopoietic stem cells (HSCs) were isolated based on the SLAM family of receptors (CD150+ LinCD48CD41Sca1+c-Kit+), isolation using methods previously described [24]. WBM, and the murine osteoblastic cell line MC3T3E1 (MC3T3) cells were prepared for evaluation of CXCR4 mRNA levels. CXCR4 mRNA levels were normalized against β-actin. *P < 0.05. (B) Immunohistochemistry for CXCR4 expression by LinSca1+CD45 cells. WBM (positive control cells), C2C12 cells (negative controls), and LinSca1+CD45 cells isolated by fluorescence-activated cell sorting (FACS) were fixed on microscope slides and stained for CXCR4 and DAPI. Differential interference contrast (DIC) imaging, immune florescence (IF) for the detection of CXCR4, and merged images are presented. Bar = 5 μm. (C) Migration assay of LinSca1+CD45 cells in response to SDF-1. Two thousand LinSca1+CD45 cells were placed in the top chamber of chemotactic wells in the presence [SDF-1 (+)] or absence [SDF-1 (−)] of 200 ng/mL SDF-1 in the bottom chamber. After 2 h, the migrating cells were quantified. Significantly more cells from SDF-1 (−) in response to SDF-1. *P < 0.05. Color images available online at www.liebertonline.com/scd.
FIG. 2.
FIG. 2.
CXCR4 expression and SDF-1 responsiveness of LinSca1+CD45 cells. (A) Expression of CXCR4 mRNA CXCR4 by LinSca1+CD45 cells as determined by quantitative RT-PCR (QRT-PCR). Freshly isolated LinSca1+CD45 very small embryonic-like (VSEL) cells, hematopoietic stem cells (HSCs) were isolated based on the SLAM family of receptors (CD150+ LinCD48CD41Sca1+c-Kit+), isolation using methods previously described [24]. WBM, and the murine osteoblastic cell line MC3T3E1 (MC3T3) cells were prepared for evaluation of CXCR4 mRNA levels. CXCR4 mRNA levels were normalized against β-actin. *P < 0.05. (B) Immunohistochemistry for CXCR4 expression by LinSca1+CD45 cells. WBM (positive control cells), C2C12 cells (negative controls), and LinSca1+CD45 cells isolated by fluorescence-activated cell sorting (FACS) were fixed on microscope slides and stained for CXCR4 and DAPI. Differential interference contrast (DIC) imaging, immune florescence (IF) for the detection of CXCR4, and merged images are presented. Bar = 5 μm. (C) Migration assay of LinSca1+CD45 cells in response to SDF-1. Two thousand LinSca1+CD45 cells were placed in the top chamber of chemotactic wells in the presence [SDF-1 (+)] or absence [SDF-1 (−)] of 200 ng/mL SDF-1 in the bottom chamber. After 2 h, the migrating cells were quantified. Significantly more cells from SDF-1 (−) in response to SDF-1. *P < 0.05. Color images available online at www.liebertonline.com/scd.
FIG. 3.
FIG. 3.
Transplantation of LinSca-1+CD45 cell generates osseous tissues in vivo. Transplantation of 500 or 5,000 LinSca-1+CD45 (VSEL) cells and 20,000 LinSca-1+CD45+ hematopoietic progenitor cells isolated from green fluorescent protein (GFP)+ mice into gelatin sponges subcutaneously in SCID mice. The transplants were harvested at 5 weeks and frozen-sections were prepared. (A) H&E staining of the transplanted tissues demonstrating trabeculae-like structures in both groups [3/4 in the 500 LinSca-1+CD45 (VSEL) cells group, whereas 4/4 in the 5,000 cell group]. Tissues recovered from the 20,000 LinSca-1+CD45+ hematopoietic progenitor cell implants demonstrate predominately collagen transplant vehicle. Size indicators; for 500 cell implants the bar represents 100 μm, for 5,000 cell implants the bar represents 50 μm, for 20,000 cell implants the bar represents 25 μm. (B) Fluorescent microscopy revealing retention of GFP expression (arrows), (C) μCT demonstrating high-density mineralized tissues in both the 500 and 5,000 cell groups; however, the 5,000 cell transplants produced more mineralized tissue. (D) The presence of mineralized tissues were confirmed by von Kossa staining (arrows). (E) In situ hybridization of osteocalcin (OCN) (arrows). Color images available online at www.liebertonline.com/scd.
FIG. 4.
FIG. 4.
LinSca-1+CD45 cells differentiate into 2 lineages in vivo. (A) Experimental scheme. Bone ossicles were established using stromal donor cells (bone marrow stromal cells, BMSCs) derived from Col2.3ΛTK mice in host SCID mice. At 1 month, ganciclovir was administered for 2 weeks to ablate mature osteoblasts. At 1.5 months, the ossicles were surgically exposed and injected with 2,000 Lin Sca-1+CD45 cells isolated from mice that express GFP [(C57BL/6-Tg(ACTB- EGFP)1Osb/J mice]. After an additional 3 months, the tissues were recovered, embedded, and frozen tissue sections were prepared for immunohistochemistry. (B) LinSca-1+CD45 cells do not express Runx-2 mRNA. mRNA was harvested from mixed BMSC, the osteoblastic MC3T3-E1 (MC3T3) cell line (a positive control), and freshly isolated LinSca-1+CD45 cells. QRT-PCR was performed to determine expression levels of the bone specific transcription factor Runx-2. mRNA levels were normalized to β-actin levels. *Significance differences at P < 0.01. (C) LinSca-1+CD45 cells do not express mRNA for peroxisome proliferator-activated receptor (PPAR-Gamma)γ. mRNA was harvested from dexamethasone treated BMSC (positive control), the osteoblastic MC3T3-E1 (MC3T3) cell line, and freshly isolated LinSca-1+CD45 cells. QRT-PCR was performed to determine expression levels of PPARγ. mRNA levels were normalized to β-actin levels. *Significant difference at P < 0.01. (D) Tissue sections demonstrating multilineage differentiation of GFP-expressing cells. Rabbit polyclonal antibodies to osteoblasts (Runx-2) were used to demonstrate colocalization of with GFP. Four individual images and merged files are presented. Cells appearing double positive for GFP and Runx-2 appear as either yellow or white (arrows). The bar indicates 10 μm. (E) Quantification of cells double positive for GFP and Runx-2 as shown in (D). The data are presented as total cells positive for Runx-2 and double positive (Runx-2 and GFP). *Significant difference from Runx-2 only at P < 0.05. (F) As in (E), tissue sections demonstrating multilineage differentiation of GFP-expressing cells. Rabbit polyclonal antibodies to adipocytes (PPARγ) were used to demonstrate colocalization of with GFP. Cells appearing double positive for GFP and PPARγ appear as either yellow or white (arrowheads). The bar indicates 10 μm. (G) Quantification of cells double positive for GFP and PPARγ as shown in (F). The data are presented as total cells positive for PPARγ and double positive (PPARγ and GFP). *Significant difference from PPARγ only at P < 0.05. Color images available online at www.liebertonline.com/scd.
FIG. 4.
FIG. 4.
LinSca-1+CD45 cells differentiate into 2 lineages in vivo. (A) Experimental scheme. Bone ossicles were established using stromal donor cells (bone marrow stromal cells, BMSCs) derived from Col2.3ΛTK mice in host SCID mice. At 1 month, ganciclovir was administered for 2 weeks to ablate mature osteoblasts. At 1.5 months, the ossicles were surgically exposed and injected with 2,000 Lin Sca-1+CD45 cells isolated from mice that express GFP [(C57BL/6-Tg(ACTB- EGFP)1Osb/J mice]. After an additional 3 months, the tissues were recovered, embedded, and frozen tissue sections were prepared for immunohistochemistry. (B) LinSca-1+CD45 cells do not express Runx-2 mRNA. mRNA was harvested from mixed BMSC, the osteoblastic MC3T3-E1 (MC3T3) cell line (a positive control), and freshly isolated LinSca-1+CD45 cells. QRT-PCR was performed to determine expression levels of the bone specific transcription factor Runx-2. mRNA levels were normalized to β-actin levels. *Significance differences at P < 0.01. (C) LinSca-1+CD45 cells do not express mRNA for peroxisome proliferator-activated receptor (PPAR-Gamma)γ. mRNA was harvested from dexamethasone treated BMSC (positive control), the osteoblastic MC3T3-E1 (MC3T3) cell line, and freshly isolated LinSca-1+CD45 cells. QRT-PCR was performed to determine expression levels of PPARγ. mRNA levels were normalized to β-actin levels. *Significant difference at P < 0.01. (D) Tissue sections demonstrating multilineage differentiation of GFP-expressing cells. Rabbit polyclonal antibodies to osteoblasts (Runx-2) were used to demonstrate colocalization of with GFP. Four individual images and merged files are presented. Cells appearing double positive for GFP and Runx-2 appear as either yellow or white (arrows). The bar indicates 10 μm. (E) Quantification of cells double positive for GFP and Runx-2 as shown in (D). The data are presented as total cells positive for Runx-2 and double positive (Runx-2 and GFP). *Significant difference from Runx-2 only at P < 0.05. (F) As in (E), tissue sections demonstrating multilineage differentiation of GFP-expressing cells. Rabbit polyclonal antibodies to adipocytes (PPARγ) were used to demonstrate colocalization of with GFP. Cells appearing double positive for GFP and PPARγ appear as either yellow or white (arrowheads). The bar indicates 10 μm. (G) Quantification of cells double positive for GFP and PPARγ as shown in (F). The data are presented as total cells positive for PPARγ and double positive (PPARγ and GFP). *Significant difference from PPARγ only at P < 0.05. Color images available online at www.liebertonline.com/scd.

References

    1. Lansdorp PM. Stem cell biology for the transfusionist. Vox Sang. 1998;74(Suppl. 2):91–94. - PubMed
    1. Lapidot T. Dar A. Kollet O. How do stem cells find their way home? Blood. 2005;106:1901–1910. - PubMed
    1. Aggarwal S. Pittenger MF. Human mesenchymal stem cells modulate allogeneic immune cell responses. Blood. 2005;105:1815–1822. - PubMed
    1. Le Blanc K. Mesenchymal stromal cells: tissue repair and immune modulation. Cytotherapy. 2006;8:559–561. - PubMed
    1. Yamaza T. Miura Y. Akiyama K. Bi Y. Sonoyama W. Gronthos S. Chen W. Le A. Shi S. Mesenchymal stem cell-mediated ectopic hematopoiesis alleviates aging-related phenotype in immunocompromised mice. Blood. 2009;113:2595–2604. - PMC - PubMed

Publication types

MeSH terms