

Effect of microbubble size on fundamental mode high frequency ultrasound imaging in mice
- PMID: 20447755
- PMCID: PMC2878876
- DOI: 10.1016/j.ultrasmedbio.2010.03.015
Effect of microbubble size on fundamental mode high frequency ultrasound imaging in mice
Abstract
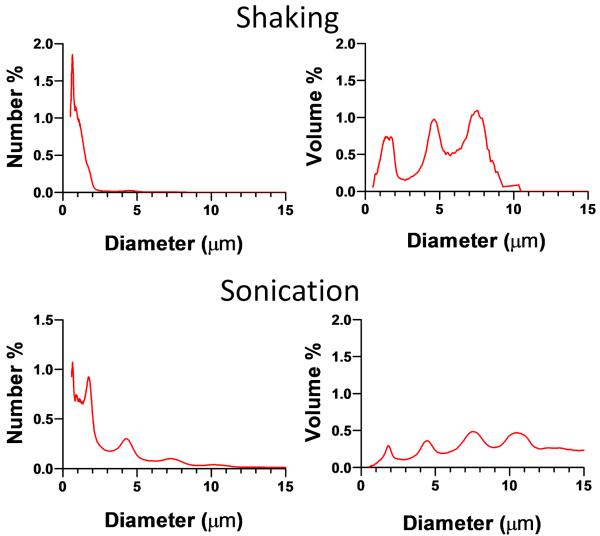
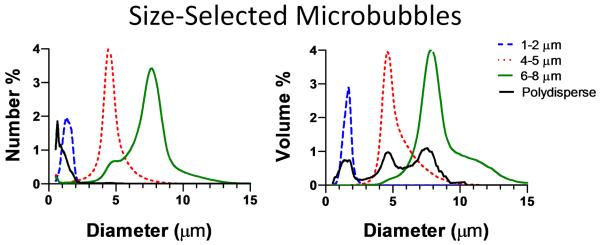
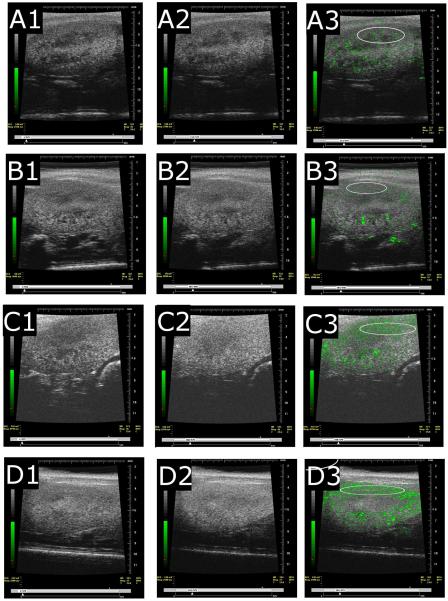
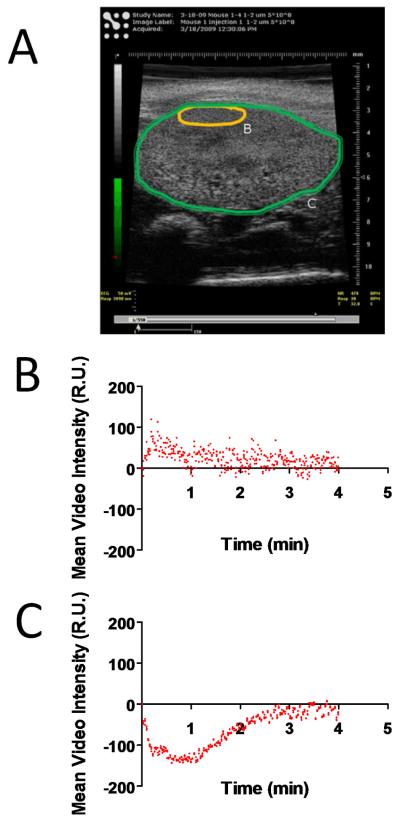
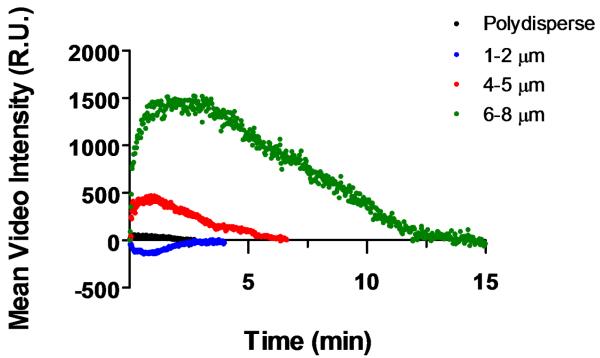
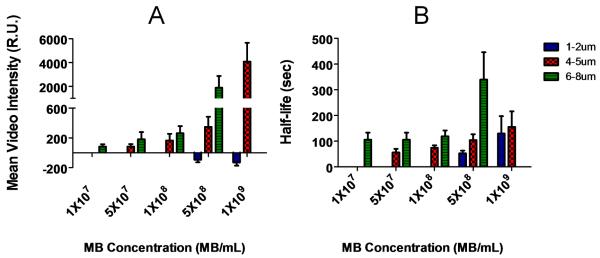
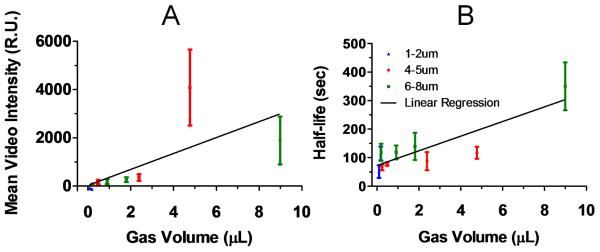
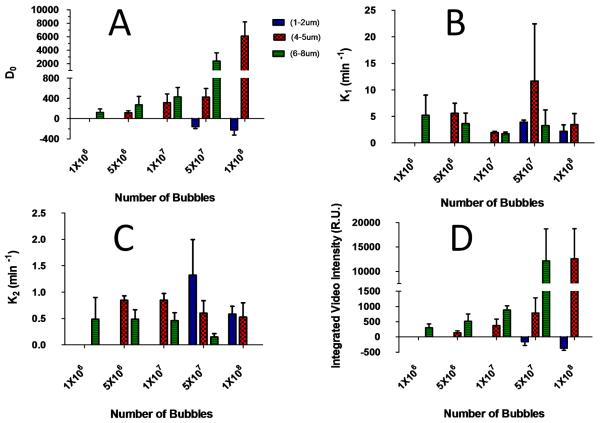
High-frequency ultrasound imaging using microbubble (MB) contrast agents is becoming increasingly popular in pre-clinical and small animal studies of anatomy, flow and vascular expression of molecular epitopes. Currently, in vivo imaging studies rely on highly polydisperse microbubble suspensions, which may provide a complex and varied acoustic response. To study the effect of individual microbubble size populations, microbubbles of 1-2 microm, 4-5 microm and 6-8 microm diameter were isolated using the technique of differential centrifugation. Size-selected microbubbles were imaged in the mouse kidney over a range of concentrations using a Visualsonics Vevo 770 ultrasound imaging system (Visualsonics, Toronto, Ontario, Canada) with a 40-MHz probe in fundamental mode. Results demonstrate that contrast enhancement and circulation persistence are strongly dependent on microbubble size and concentration. Large microbubbles (4-5 and 6-8 microm) strongly enhanced the ultrasound image with positive contrast, while 1-2 microm microbubbles showed little enhancement. For example, the total integrated contrast enhancement, measured by the area under the time-intensity curve (AUC), increased 16-fold for 6-8 microm diameter microbubbles at 5 x 10(7) MB/bolus compared with 4-5 microm microbubbles at the same concentration. Interestingly, 1-2 microm diameter microbubbles, at any concentration, did not measurably enhance the integrated ultrasound signal at tissue depth, but did noticeably attenuate the signal, indicating that they had a low scattering-to-attenuation ratio. When concentration matched, larger microbubbles were more persistent in circulation. However, when volume matched, all microbubble sizes had a similar circulation half-life. These results indicated that dissolution of the gas core plays a larger role in contrast elimination than filtering by the lungs and spleen. The results of this study show that microbubbles can be tailored for optimal contrast enhancement in fundamental mode imaging.
Copyright 2010 World Federation for Ultrasound in Medicine & Biology. Published by Elsevier Inc. All rights reserved.
Figures
Similar articles
-
Effect of surface architecture on in vivo ultrasound contrast persistence of targeted size-selected microbubbles.Ultrasound Med Biol. 2012 Mar;38(3):492-503. doi: 10.1016/j.ultrasmedbio.2011.12.007. Ultrasound Med Biol. 2012. PMID: 22305060 Free PMC article.
-
Ultrasound contrast agents: basic principles.Eur J Radiol. 1998 May;27 Suppl 2:S157-60. doi: 10.1016/s0720-048x(98)00057-6. Eur J Radiol. 1998. PMID: 9652516 Review.
-
Renal retention of lipid microbubbles: a potential mechanism for flank discomfort during ultrasound contrast administration.J Am Soc Echocardiogr. 2013 Dec;26(12):1474-81. doi: 10.1016/j.echo.2013.08.004. Epub 2013 Sep 12. J Am Soc Echocardiogr. 2013. PMID: 24035699 Free PMC article.
-
Novel ultrasound contrast agent based on microbubbles generated from surfactant mixtures of Span 60 and polyoxyethylene 40 stearate.Acta Biomater. 2010 Sep;6(9):3542-9. doi: 10.1016/j.actbio.2010.03.007. Epub 2010 Mar 10. Acta Biomater. 2010. PMID: 20226284
-
Italian Society of Cardiovascular Echography (SIEC) Consensus Conference on the state of the art of contrast echocardiography.Ital Heart J. 2004 Apr;5(4):309-34. Ital Heart J. 2004. PMID: 15185894 Review.
Cited by
-
Microbubble Size and Dose Effects on Pharmacokinetics.ACS Biomater Sci Eng. 2022 Apr 11;8(4):1686-1695. doi: 10.1021/acsbiomaterials.2c00043. Epub 2022 Mar 31. ACS Biomater Sci Eng. 2022. PMID: 35357814 Free PMC article.
-
Noninvasive and localized blood-brain barrier disruption using focused ultrasound can be achieved at short pulse lengths and low pulse repetition frequencies.J Cereb Blood Flow Metab. 2011 Feb;31(2):725-37. doi: 10.1038/jcbfm.2010.155. Epub 2010 Sep 15. J Cereb Blood Flow Metab. 2011. PMID: 20842160 Free PMC article.
-
Theranostics in the vasculature: bioeffects of ultrasound and microbubbles to induce vascular shutdown.Theranostics. 2023 Jul 14;13(12):4079-4101. doi: 10.7150/thno.70372. eCollection 2023. Theranostics. 2023. PMID: 37554276 Free PMC article. Review.
-
Formulation and Characterization of Chemically Cross-linked Microbubble Clusters.Langmuir. 2019 Aug 20;35(33):10977-10986. doi: 10.1021/acs.langmuir.9b00475. Epub 2019 Aug 7. Langmuir. 2019. PMID: 31310715 Free PMC article.
-
Targeted Microbubbles for Drug, Gene, and Cell Delivery in Therapy and Immunotherapy.Pharmaceutics. 2023 May 30;15(6):1625. doi: 10.3390/pharmaceutics15061625. Pharmaceutics. 2023. PMID: 37376072 Free PMC article. Review.
References
-
- Borden MA, Longo ML. Dissolution Behavior of Lipid Monolayer-Coated, Air-Filled Microbubbles:â€% Effect of Lipid Hydrophobic Chain Length. Langmuir. 2002;18:9225–33.
-
- Borden MA, Longo ML. Oxygen permeability of fully condensed lipid monolayers. J Phys Chem B. 2004;108:6009–16.
-
- Bouakaz A, De Jong N, Cachard C. Standard properties of ultrasound contrast agents. Ultrasound Med Biol. 1998a;24:469–72. - PubMed
-
- Bouakaz A, de Jong N, Cachard C, Jouini K. On the effect of lung filtering and cardiac pressure on the standard properties of ultrasound contrast agent. Ultrasonics. 1998b;36:703–8. - PubMed
-
- Chan M, Soetanto K, Okujima M. Simulations of Contrast Effects from Free Microbubbles in Relation to Their Size, Concentration and Acoustic Properties. Jpn J Appl Phys. 1997;36:3.
Publication types
MeSH terms
Substances
Grants and funding
LinkOut - more resources
Full Text Sources
Other Literature Sources
Miscellaneous
