Pitfalls and solutions in assaying anandamide transport in cells
- PMID: 20447929
- PMCID: PMC2903826
- DOI: 10.1194/jlr.D004176
Pitfalls and solutions in assaying anandamide transport in cells
Erratum in
- J Lipid Res. 2012 Jun;53(6):1243
Abstract
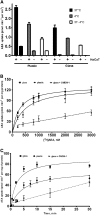
Nonspecific binding of anandamide to plastic exhibits many features that could be mistaken as biological processes, thereby representing an important source of conflicting data on the uptake and release of this lipophilic substance. Herein, we propose an improved method to assay anandamide transport, by using glass slides (i.e., coverslips) as physical support to grow cells. Although the results obtained using plastic do not differ significantly from those obtained using glass, the new procedure has the advantage of being faster, simpler, and more accurate. In fact, the lack of aspecific adsorption of anandamide to the glass surface yields a lower background and a higher precision and accuracy in determining transport kinetics, especially for the export process. Remarkably, the kinetic parameters of anandamide uptake obtained with the old and the new procedures may be similar or different depending on the cell type, thus demonstrating the complexity of the interference of plastic on the transport process. In addition, the novel procedure is particularly suitable for visualization and measurement of anandamide transport in intact cells by using a biotinylated derivative in confocal fluorescence microscopy.
Figures


Similar articles
-
Molecular identification of albumin and Hsp70 as cytosolic anandamide-binding proteins.Chem Biol. 2009 Jun 26;16(6):624-32. doi: 10.1016/j.chembiol.2009.05.004. Epub 2009 May 29. Chem Biol. 2009. PMID: 19481477
-
Intracellular trafficking of anandamide: new concepts for signaling.Trends Biochem Sci. 2010 Nov;35(11):601-8. doi: 10.1016/j.tibs.2010.05.008. Epub 2010 Jun 8. Trends Biochem Sci. 2010. PMID: 20570522
-
Visualization of Endocannabinoids in the Cell.Methods Mol Biol. 2023;2576:453-459. doi: 10.1007/978-1-0716-2728-0_37. Methods Mol Biol. 2023. PMID: 36152209
-
Anandamide transport.Pharmacol Ther. 2004 Nov;104(2):117-35. doi: 10.1016/j.pharmthera.2004.07.008. Pharmacol Ther. 2004. PMID: 15518883 Review.
-
Transport of endocannabinoids across the plasma membrane and within the cell.FEBS J. 2013 May;280(9):1895-904. doi: 10.1111/febs.12212. Epub 2013 Mar 18. FEBS J. 2013. PMID: 23441874 Review.
Cited by
-
Evidence for bidirectional endocannabinoid transport across cell membranes.J Biol Chem. 2012 Oct 5;287(41):34660-82. doi: 10.1074/jbc.M112.373241. Epub 2012 Aug 9. J Biol Chem. 2012. PMID: 22879589 Free PMC article.
-
Characterization of the endocannabinoid system, CB(1) receptor signalling and desensitization in human myometrium.Br J Pharmacol. 2011 Nov;164(5):1479-94. doi: 10.1111/j.1476-5381.2011.01425.x. Br J Pharmacol. 2011. PMID: 21486283 Free PMC article.
-
Goods and Bads of the Endocannabinoid System as a Therapeutic Target: Lessons Learned after 30 Years.Pharmacol Rev. 2023 Sep;75(5):885-958. doi: 10.1124/pharmrev.122.000600. Epub 2023 May 10. Pharmacol Rev. 2023. PMID: 37164640 Free PMC article. Review.
-
Identification of a Widespread Palmitoylethanolamide Contamination in Standard Laboratory Glassware.Cannabis Cannabinoid Res. 2017 Jun 1;2(1):123-132. doi: 10.1089/can.2017.0019. eCollection 2017. Cannabis Cannabinoid Res. 2017. PMID: 28861512 Free PMC article.
References
-
- Devane W. A., Hanus L., Breuer A., Pertwee R. G., Stevenson L. A., Griffin G., Gibson D., Mandelbaum A., Etinger A., Mechoulam R. 1992. Isolation and structure of a brain constituent that binds to the cannabinoid receptor. Science. 258: 1946–1949. - PubMed
-
- Van der Stelt M., Di Marzo V. 2005. Anandamide as an intracellular messenger regulating ion channel activity. Prostaglandins Other Lipid Mediat. 77: 111–122. - PubMed
-
- Starowicz K., Nigam S., Di Marzo V. 2007. Biochemistry and pharmacology of endovanilloids. Pharmacol. Ther. 114: 13–33. - PubMed
-
- Sawzdargo M., Nguyen T., Lee D. K., Lynch K. R., Cheng R., Heng H. H., George S. R., O'Dowd B. F. 1999. Identification and cloning of three novel human G protein-coupled receptor genes GPR52, PsiGPR53 and GPR55: GPR55 is extensively expressed in human brain. Brain Res. Mol. Brain Res. 64: 193–198. - PubMed

