

Binding of imidazole to the heme of cytochrome c1 and inhibition of the bc1 complex from Rhodobacter sphaeroides: I. Equilibrium and modeling studies
- PMID: 20448035
- PMCID: PMC2903416
- DOI: 10.1074/jbc.M110.128058
Binding of imidazole to the heme of cytochrome c1 and inhibition of the bc1 complex from Rhodobacter sphaeroides: I. Equilibrium and modeling studies
Abstract
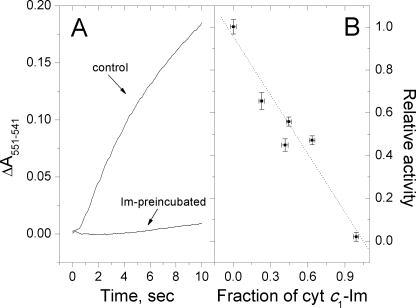
We have used imidazole (Im) and N-methylimidazole (MeIm) as probes of the heme-binding cavity of membrane-bound cytochrome (cyt) c(1) in detergent-solubilized bc(1) complex from Rhodobacter sphaeroides. Imidazole binding to cyt c(1) substantially lowers the midpoint potential of the heme and fully inhibits bc(1) complex activity. Temperature dependences showed that binding of Im (K(d) approximately 330 microM, 25 degrees C, pH 8) is enthalpically driven (DeltaH(0) = -56 kJ/mol, DeltaS(0) = -121 J/mol/K), whereas binding of MeIm is 30 times weaker (K(d) approximately 9.3 mM) and is entropically driven (DeltaH(0) = 47 kJ/mol, DeltaS(0)(o) = 197 J/mol/K). The large enthalpic and entropic contributions suggest significant structural and solvation changes in cyt c(1) triggered by ligand binding. Comparison of these results with those obtained previously for soluble cyts c and c(2) suggested that Im binding to cyt c(1) is assisted by formation of hydrogen bonds within the heme cleft. This was strongly supported by molecular dynamics simulations of Im adducts of cyts c, c(2), and c(1), which showed hydrogen bonds formed between the N(delta)H of Im and the cyt c(1) protein, or with a water molecule sequestered with the ligand in the heme cleft.
Figures


Similar articles
-
Binding of imidazole to the heme of cytochrome c1 and inhibition of the bc1 complex from Rhodobacter sphaeroides: II. Kinetics and mechanism of binding.J Biol Chem. 2010 Jul 16;285(29):22522-31. doi: 10.1074/jbc.M110.128082. Epub 2010 May 6. J Biol Chem. 2010. PMID: 20448037 Free PMC article.
-
Resilience of Rhodobacter sphaeroides cytochrome bc1 to heme c1 ligation changes.Biochemistry. 2006 Dec 5;45(48):14247-55. doi: 10.1021/bi061345i. Biochemistry. 2006. PMID: 17128964
-
Substitution of the sixth axial ligand of Rhodobacter capsulatus cytochrome c1 heme yields novel cytochrome c1 variants with unusual properties.Biochemistry. 1999 Jun 22;38(25):7908-17. doi: 10.1021/bi990211k. Biochemistry. 1999. PMID: 10387032
-
The bc1 complexes of Rhodobacter sphaeroides and Rhodobacter capsulatus.J Bioenerg Biomembr. 1993 Jun;25(3):195-209. doi: 10.1007/BF00762582. J Bioenerg Biomembr. 1993. PMID: 8394316 Review.
-
Structural basis of multifunctional bovine mitochondrial cytochrome bc1 complex.J Bioenerg Biomembr. 1999 Jun;31(3):191-9. doi: 10.1023/a:1005411510913. J Bioenerg Biomembr. 1999. PMID: 10591525 Review.
Cited by
-
Regulation of cytochrome c oxidase activity by modulation of the catalytic site.Sci Rep. 2018 Jul 30;8(1):11397. doi: 10.1038/s41598-018-29567-4. Sci Rep. 2018. PMID: 30061583 Free PMC article.
-
Tyrosine triad at the interface between the Rieske iron-sulfur protein, cytochrome c1 and cytochrome c2 in the bc1 complex of Rhodobacter capsulatus.Biochim Biophys Acta. 2012 May;1817(5):811-8. doi: 10.1016/j.bbabio.2012.01.013. Epub 2012 Jan 28. Biochim Biophys Acta. 2012. PMID: 22306765 Free PMC article.
-
Kinetic and equilibrium studies of acrylonitrile binding to cytochrome c peroxidase and oxidation of acrylonitrile by cytochrome c peroxidase compound I.Biochem Biophys Res Commun. 2014 Jan 3;443(1):200-4. doi: 10.1016/j.bbrc.2013.11.084. Epub 2013 Nov 28. Biochem Biophys Res Commun. 2014. PMID: 24291498 Free PMC article.
-
Binding of imidazole, 1-methylimidazole and 4-nitroimidazole to yeast cytochrome c peroxidase (CcP) and the distal histidine mutant, CcP(H52L).Biochim Biophys Acta. 2015 Aug;1854(8):869-81. doi: 10.1016/j.bbapap.2015.04.013. Epub 2015 Apr 20. Biochim Biophys Acta. 2015. PMID: 25907133 Free PMC article.
-
The acidic domain of cytochrome c₁ in paracoccus denitrificans, analogous to the acidic subunits in eukaryotic bc₁ complexes, is not involved in the electron transfer reaction to its native substrate cytochrome c(552).Biochim Biophys Acta. 2011 Nov;1807(11):1383-9. doi: 10.1016/j.bbabio.2011.08.001. Epub 2011 Aug 11. Biochim Biophys Acta. 2011. PMID: 21856278 Free PMC article.
References
-
- Scott R. A., Mauk A. G. (eds) (1996) Cytochrome c: A Multidisciplinary Approach, University Science Books, Sausalito, CA
-
- Battistuzzi G., Borsari M., Sola M. (2001) Antioxid. Redox Signal. 3, 279–291 - PubMed
-
- Maity H., Maity M., Englander S. W. (2004) J. Mol. Biol. 343, 223–233 - PubMed
-
- Moore G. R., Pettigrew G. W. (1990) Cytochromes c: Evolutionary, Structural and Physiochemical Aspects, Springer, Berlin
Publication types
MeSH terms
Substances
Grants and funding
LinkOut - more resources
Full Text Sources
Miscellaneous
