

Mechanisms of HIV-tat-induced phosphorylation of N-methyl-D-aspartate receptor subunit 2A in human primary neurons: implications for neuroAIDS pathogenesis
- PMID: 20448061
- PMCID: PMC2877843
- DOI: 10.2353/ajpath.2010.090642
Mechanisms of HIV-tat-induced phosphorylation of N-methyl-D-aspartate receptor subunit 2A in human primary neurons: implications for neuroAIDS pathogenesis
Abstract
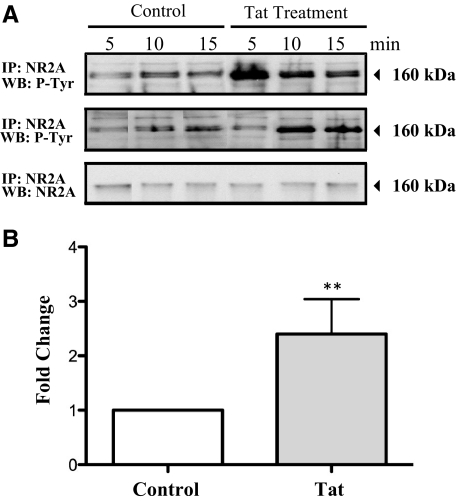
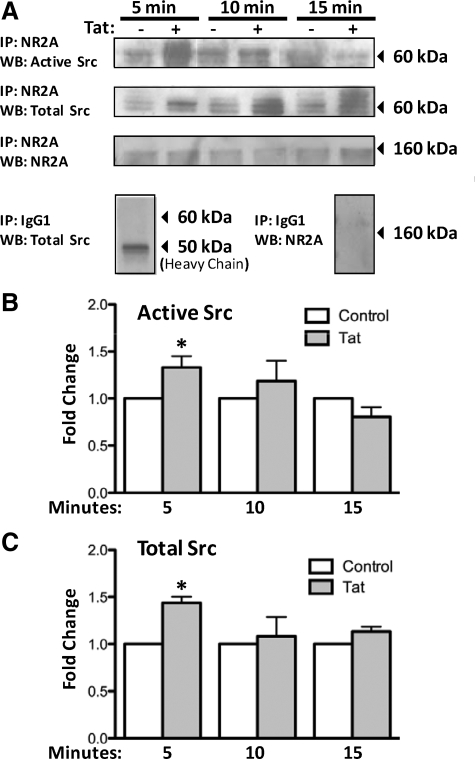
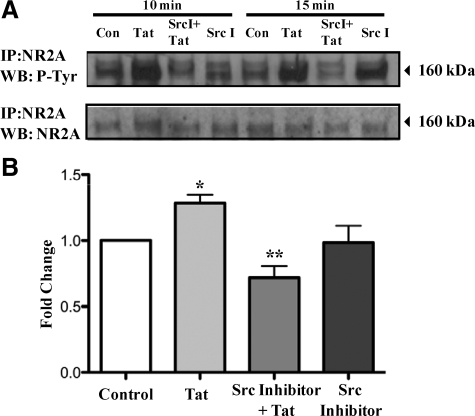
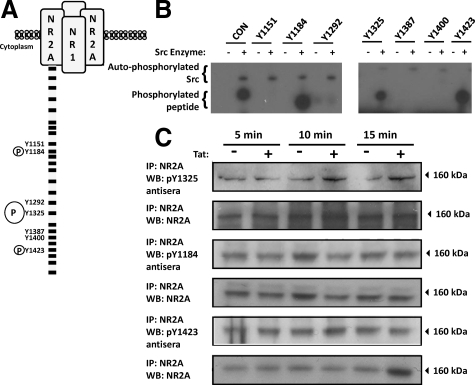
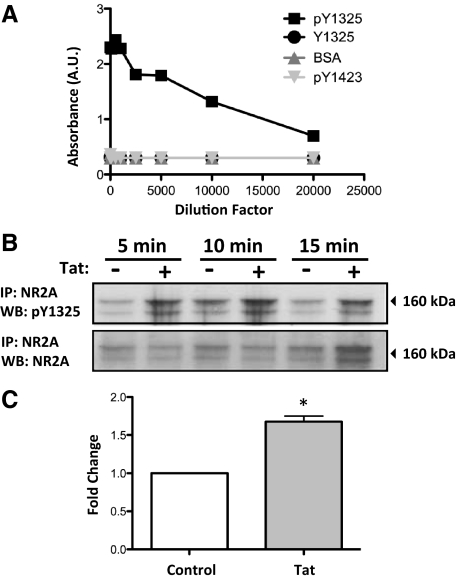
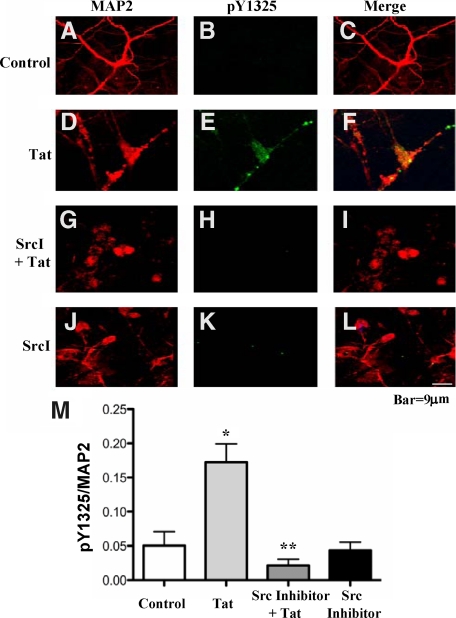
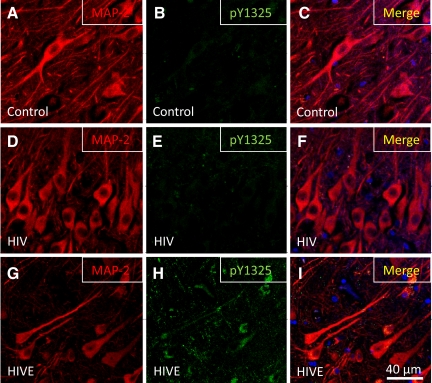
HIV infection of the central nervous system results in neurological dysfunction in a large number of individuals. NeuroAIDS is characterized by neuronal injury and loss, yet there is no evidence of HIV-infected neurons. Neuronal damage and dropout must therefore be due to indirect effects of HIV infection of other central nervous system cells through elaboration of inflammatory factors and neurotoxic viral proteins, including the viral transactivator, tat. We previously demonstrated that HIV-tat-induced apoptosis in human primary neurons is dependent on N-methyl-D-aspartate receptor (NMDAR) activity. NMDAR activity is regulated by various mechanisms including NMDAR phosphorylation, which may lead to neuronal dysfunction and apoptosis in pathological conditions. We now demonstrate that tat treatment of human neurons results in tyrosine (Y) phosphorylation of the NMDAR subunit 2A (NR2A) in a src kinase-dependent manner. In vitro kinase assays and in vivo data indicated that NR2A Y1184, Y1325, and Y1425 are phosphorylated. Tat treatment of neuronal cultures enhanced phosphorylation of NR2A Y1325, indicating that this site is tat sensitive. Human brain tissue sections from HIV-infected individuals with encephalitis showed an increased phosphorylation of NR2A Y1325 in neurons as compared with uninfected and HIV-infected individuals without encephalitis. These findings suggest new avenues of treatment for HIV-associated cognitive impairment.
Figures
Similar articles
-
Differences in NMDA receptor expression during human development determine the response of neurons to HIV-tat-mediated neurotoxicity.Neurotox Res. 2011 Jan;19(1):138-48. doi: 10.1007/s12640-010-9150-x. Epub 2010 Jan 22. Neurotox Res. 2011. PMID: 20094923 Free PMC article.
-
HIV-1 protein Tat produces biphasic changes in NMDA-evoked increases in intracellular Ca2+ concentration via activation of Src kinase and nitric oxide signaling pathways.J Neurochem. 2014 Sep;130(5):642-56. doi: 10.1111/jnc.12724. Epub 2014 Apr 19. J Neurochem. 2014. PMID: 24666322 Free PMC article.
-
Neurotoxic effects of the human immunodeficiency virus type-1 transcription factor Tat require function of a polyamine sensitive-site on the N-methyl-D-aspartate receptor.Brain Res. 2002 Nov 8;954(2):300-7. doi: 10.1016/s0006-8993(02)03360-7. Brain Res. 2002. PMID: 12414113
-
HIV-1 Tat-Mediated Calcium Dysregulation and Neuronal Dysfunction in Vulnerable Brain Regions.Curr Drug Targets. 2016;17(1):4-14. doi: 10.2174/1389450116666150531162212. Curr Drug Targets. 2016. PMID: 26028040 Free PMC article. Review.
-
HIV tat and neurotoxicity.Microbes Infect. 2006 Apr;8(5):1347-57. doi: 10.1016/j.micinf.2005.11.014. Epub 2006 Jan 26. Microbes Infect. 2006. PMID: 16697675 Review.
Cited by
-
Mechanisms of HIV Neuropathogenesis: Role of Cellular Communication Systems.Curr HIV Res. 2016;14(5):400-411. doi: 10.2174/1570162x14666160324124558. Curr HIV Res. 2016. PMID: 27009098 Free PMC article. Review.
-
Mechanisms of neuronal dysfunction in HIV-associated neurocognitive disorders.Cell Mol Life Sci. 2021 May;78(9):4283-4303. doi: 10.1007/s00018-021-03785-y. Epub 2021 Feb 13. Cell Mol Life Sci. 2021. PMID: 33585975 Free PMC article. Review.
-
PrPC, the cellular isoform of the human prion protein, is a novel biomarker of HIV-associated neurocognitive impairment and mediates neuroinflammation.Am J Pathol. 2010 Oct;177(4):1848-60. doi: 10.2353/ajpath.2010.091006. Epub 2010 Aug 19. Am J Pathol. 2010. PMID: 20724601 Free PMC article.
-
HIV-1 Tat-mediated apoptosis in human blood-retinal barrier-associated cells.PLoS One. 2014 Apr 16;9(4):e95420. doi: 10.1371/journal.pone.0095420. eCollection 2014. PLoS One. 2014. PMID: 24739951 Free PMC article.
-
Curcumin ameliorates hippocampal neuron damage induced by human immunodeficiency virus-1.Neural Regen Res. 2013 May 25;8(15):1368-75. doi: 10.3969/j.issn.1673-5374.2013.15.003. Neural Regen Res. 2013. PMID: 25206431 Free PMC article.
References
-
- McArthur JC. HIV dementia: an evolving disease. J Neuroimmunol. 2004;157:3–10. - PubMed
-
- Sacktor N. The epidemiology of human immunodeficiency virus-associated neurological disease in the era of highly active antiretroviral therapy. J Neurovirol. 2002;8:115–121. - PubMed
-
- King JE, Eugenin EA, Buckner CM, Berman JW. HIV tat and neurotoxicity. Microb Infect. 2006;8:1347–1357. - PubMed
-
- Bell JE. The neuropathology of adult HIV infection. Rev Neurol (Paris) 1998;154:816–829. - PubMed
-
- Takahashi K, Wesselingh SL, Griffin DE, McArthur JC, Johnson RT, Glass JD. Localization of HIV-1 in human brain using polymerase chain reaction/in situ hybridization and immunocytochemistry. Ann Neurol. 1996;39:705–711. - PubMed
Publication types
MeSH terms
Substances
Grants and funding
- AI-051519/AI/NIAID NIH HHS/United States
- R01 MH096625/MH/NIMH NIH HHS/United States
- MH083497/MH/NIMH NIH HHS/United States
- T32 AI007501/AI/NIAID NIH HHS/United States
- U01083501/PHS HHS/United States
- R01 MH075679/MH/NIMH NIH HHS/United States
- T32 GM007288/GM/NIGMS NIH HHS/United States
- R24 MH059724/MH/NIMH NIH HHS/United States
- T32 AI-007501/AI/NIAID NIH HHS/United States
- P30 AI051519/AI/NIAID NIH HHS/United States
- R24MH59724/MH/NIMH NIH HHS/United States
- R01 MH070297/MH/NIMH NIH HHS/United States
- MH075679/MH/NIMH NIH HHS/United States
- K01 MH076679/MH/NIMH NIH HHS/United States
- MH070297/MH/NIMH NIH HHS/United States
LinkOut - more resources
Full Text Sources
Molecular Biology Databases
Miscellaneous
