Review
. 2009 Jul-Aug;1(1):4-14.
doi: 10.1002/wsbm.33.

Multiscale modeling for biologists

Affiliations
Review

Multiscale modeling for biologists

Martin Meier-Schellersheim et al. Wiley Interdiscip Rev Syst Biol Med. 2009 Jul-Aug.

Abstract

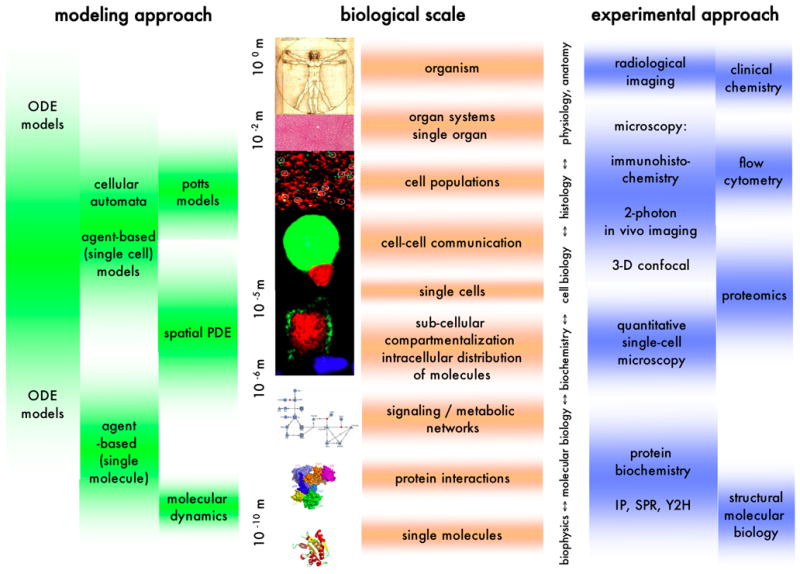
Biomedical research frequently involves performing experiments and developing hypotheses that link different scales of biological systems such as, for instance, the scales of intracellular molecular interactions to the scale of cellular behavior and beyond to the behavior of cell populations. Computational modeling efforts that aim at exploring such multiscale systems quantitatively with the help of simulations have to incorporate several different simulation techniques because of the different time and space scales involved. Here, we provide a nontechnical overview of how different scales of experimental research can be combined with the appropriate computational modeling techniques. We also show that current modeling software permits building and simulating multiscale models without having to become involved with the underlying technical details of computational modeling.


Figures

Figure 1
Figure 1
A diagrammatic representation of different biological scales and their associated modeling techniques and experimental approaches. Abbreviations: ODE: ordinary differential equation; PDE: partial differential equation; IP: immuno-precipitation; SPR: surface plasmon resonance; Y2H: yeast two-hybrid.
Figure 2
Figure 2. Screenshots of the user interface of the Simmune modeling and simulation software
(A) Defining molecular properties, interactions and multi-molecular complexes using iconographic representations for molecules and their binding sites. Binding possibilities between molecular binding sites can be defined by drawing a line between the sites and then specifying the interaction rates (for association and dissociation). Based on these user inputs the software generates the complete network of multi-molecular complexes. The same iconographic symbols as were used to specify molecular properties can be used to define (right hand panel) for which complexes (out of all the complexes of the automatically constructed signaling network) the simulation should report concentration time courses. (B) Right hand panel: Cells (green and dark-blue disks) are moving in a concentration gradient of a chemoattractant (indicated by red lines). Receptors on the cells’ surfaces bind to the chemoattractant and signal into an intracellular chemosensing signaling network. The biochemical polarization of the responding cells is coupled to a stimulus-response mechanism for directed movement of the cells along the polarization axis. A second stimulus response mechanism translates supra-threshold ligation of the receptor into secretion of a molecular agent into the extracellular milieu (light blue lines). Cells can be selected for detailed inspection of their intracellular biochemistry by mouse click. The left hand panel shows this display of concentration time courses in different regions of one selected cell.

References

    1. Burrage K, Hood L, Ragan MA. Advanced computing for systems biology. Brief Bioinform. 2006;7(4):390–8. - PubMed
    1. Hunter PJ, Crampin EJ, Nielsen PM. Bioinformatics, multiscale modeling and the IUPS Physiome Project. Brief Bioinform. 2008;9(4):333–43. - PubMed
    1. Parent CA, Devreotes PN. A cell’s sense of direction. Science. 1999;284(5415):765–70. - PubMed
    1. Iijima M, Huang YE, Devreotes P. Temporal and spatial regulation of chemotaxis. Dev Cell. 2002;3(4):469–78. - PubMed
    1. Merlot S, Firtel RA. Leading the way: Directional sensing through phosphatidylinositol 3-kinase and other signaling pathways. J Cell Sci. 2003;116(Pt 17):3471–8. - PubMed

Publication types