

Solid-state dynamic nuclear polarization at 263 GHz: spectrometer design and experimental results
- PMID: 20449524
- PMCID: PMC4442492
- DOI: 10.1039/c003685b
Solid-state dynamic nuclear polarization at 263 GHz: spectrometer design and experimental results
Abstract
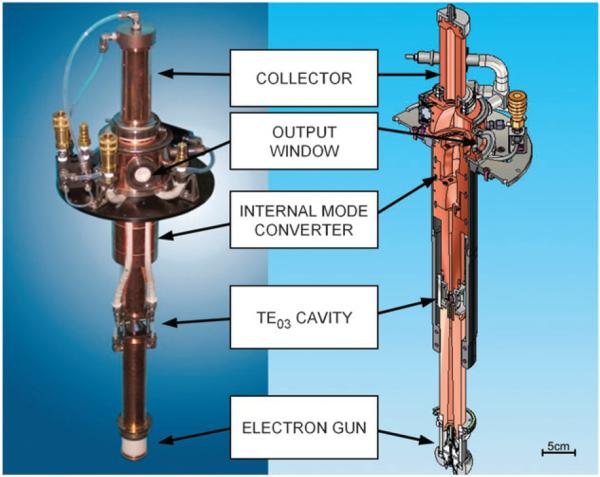
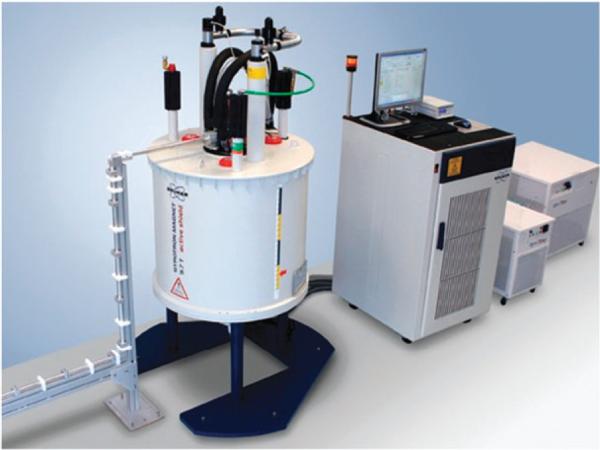
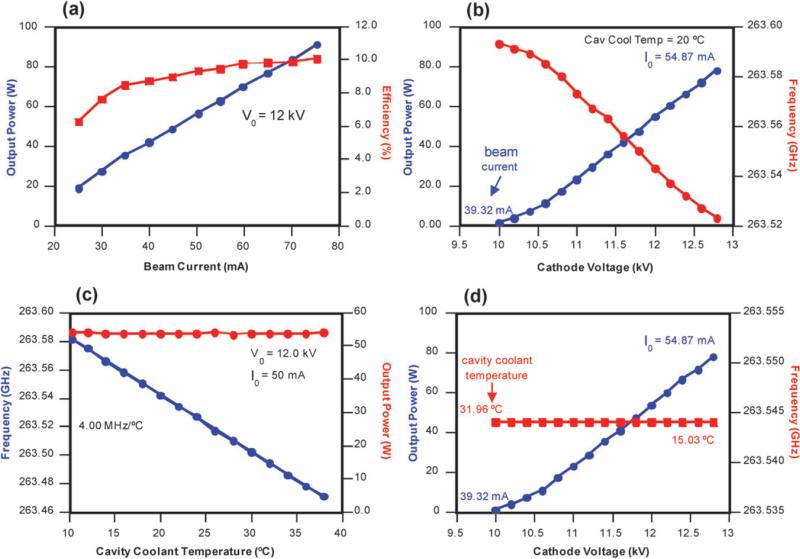
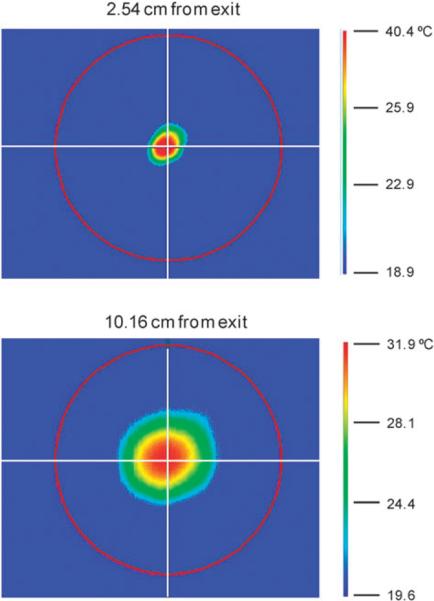
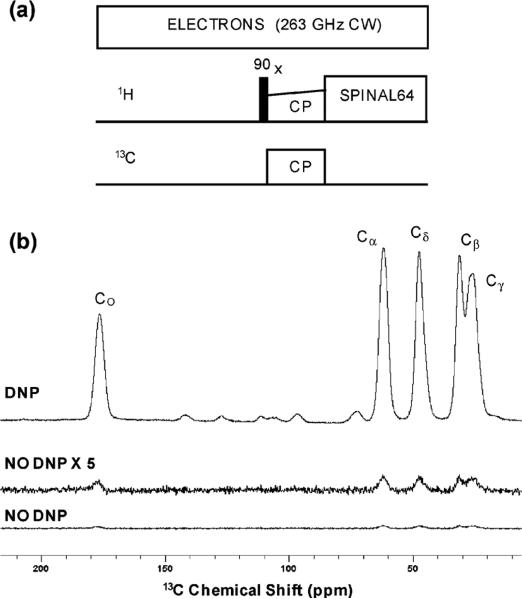
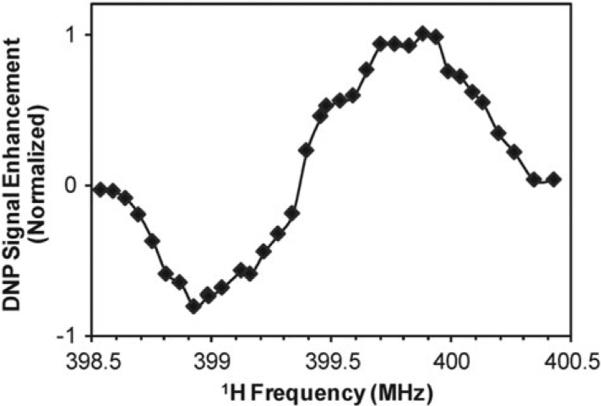
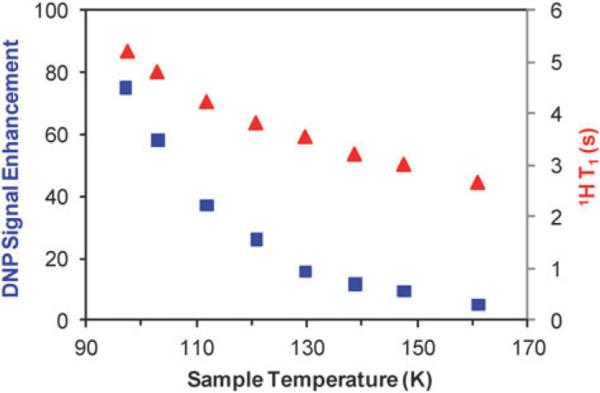
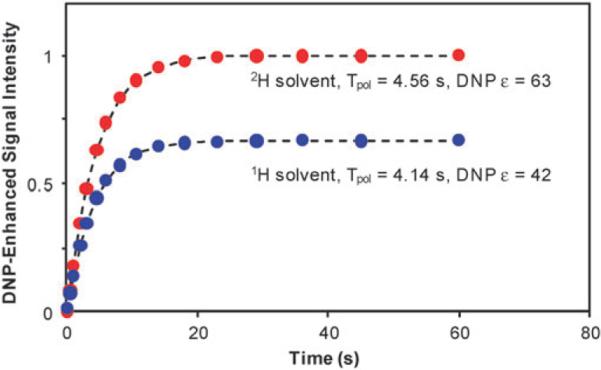
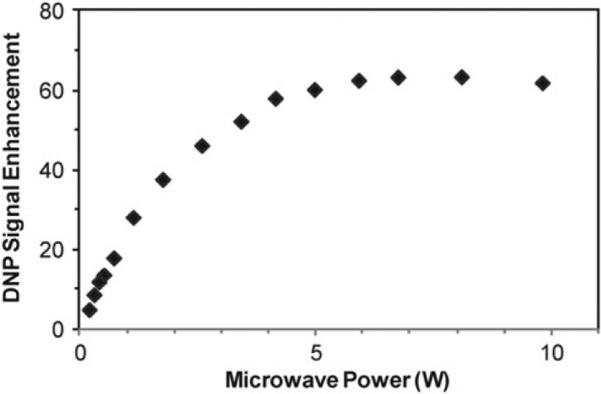
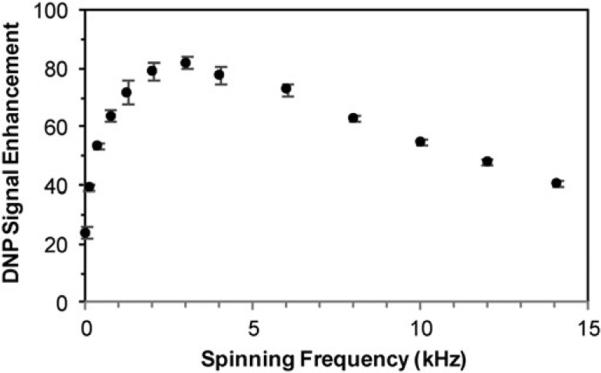
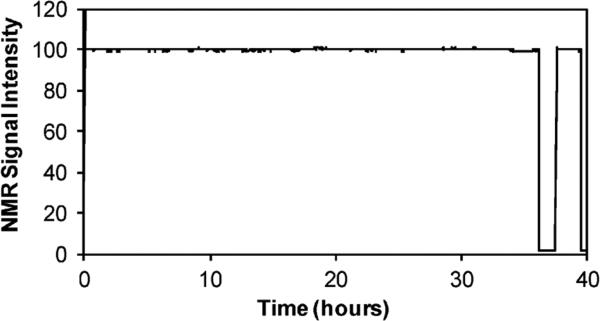
Dynamic Nuclear Polarization (DNP) experiments transfer polarization from electron spins to nuclear spins with microwave irradiation of the electron spins for enhanced sensitivity in nuclear magnetic resonance (NMR) spectroscopy. Design and testing of a spectrometer for magic angle spinning (MAS) DNP experiments at 263 GHz microwave frequency, 400 MHz (1)H frequency is described. Microwaves are generated by a novel continuous-wave gyrotron, transmitted to the NMR probe via a transmission line, and irradiated on a 3.2 mm rotor for MAS DNP experiments. DNP signal enhancements of up to 80 have been measured at 95 K on urea and proline in water-glycerol with the biradical polarizing agent TOTAPOL. We characterize the experimental parameters affecting the DNP efficiency: the magnetic field dependence, temperature dependence and polarization build-up times, microwave power dependence, sample heating effects, and spinning frequency dependence of the DNP signal enhancement. Stable system operation, including DNP performance, is also demonstrated over a 36 h period.
Figures
Similar articles
-
A spectrometer designed for 6.7 and 14.1 T DNP-enhanced solid-state MAS NMR using quasi-optical microwave transmission.J Magn Reson. 2012 Feb;215:1-9. doi: 10.1016/j.jmr.2011.12.006. Epub 2011 Dec 11. J Magn Reson. 2012. PMID: 22218011
-
Dynamic nuclear polarization experiments at 14.1 T for solid-state NMR.Phys Chem Chem Phys. 2010 Jun 14;12(22):5799-803. doi: 10.1039/c002268c. Phys Chem Chem Phys. 2010. PMID: 20518128
-
Microwave field distribution in a magic angle spinning dynamic nuclear polarization NMR probe.J Magn Reson. 2011 May;210(1):16-23. doi: 10.1016/j.jmr.2011.02.001. Epub 2011 Mar 5. J Magn Reson. 2011. PMID: 21382733 Free PMC article.
-
Polarizing agents and mechanisms for high-field dynamic nuclear polarization of frozen dielectric solids.Solid State Nucl Magn Reson. 2011 Sep;40(2):31-41. doi: 10.1016/j.ssnmr.2011.08.001. Epub 2011 Aug 6. Solid State Nucl Magn Reson. 2011. PMID: 21855299 Free PMC article. Review.
-
DNP NMR of biomolecular assemblies.J Struct Biol. 2019 Apr 1;206(1):90-98. doi: 10.1016/j.jsb.2018.09.011. Epub 2018 Sep 29. J Struct Biol. 2019. PMID: 30273657 Review.
Cited by
-
Efficient cross-effect dynamic nuclear polarization without depolarization in high-resolution MAS NMR.Chem Sci. 2017 Dec 1;8(12):8150-8163. doi: 10.1039/c7sc02199b. Epub 2017 Oct 2. Chem Sci. 2017. PMID: 29619170 Free PMC article.
-
Amplifying dynamic nuclear polarization of frozen solutions by incorporating dielectric particles.J Am Chem Soc. 2014 Nov 5;136(44):15711-8. doi: 10.1021/ja5088453. Epub 2014 Oct 23. J Am Chem Soc. 2014. PMID: 25285480 Free PMC article.
-
Dynamic nuclear polarization at 700 MHz/460 GHz.J Magn Reson. 2012 Nov;224:1-7. doi: 10.1016/j.jmr.2012.08.002. Epub 2012 Aug 14. J Magn Reson. 2012. PMID: 23000974 Free PMC article.
-
De novo prediction of cross-effect efficiency for magic angle spinning dynamic nuclear polarization.Phys Chem Chem Phys. 2019 Jan 23;21(4):2166-2176. doi: 10.1039/c8cp06819d. Phys Chem Chem Phys. 2019. PMID: 30644474 Free PMC article.
-
Rational design of dinitroxide biradicals for efficient cross-effect dynamic nuclear polarization.Chem Sci. 2016 Jan 1;7(1):550-558. doi: 10.1039/c5sc02921j. Epub 2015 Oct 13. Chem Sci. 2016. PMID: 29896347 Free PMC article.
References
-
- Griffin RG. Nat. Struct. Biol. 1998;5:508–512. - PubMed
-
- Griffiths JM, Lakshmi KV, Bennett AE, Raap J, Vanderwielen CM, Lugtenburg J, Herzfeld J, Griffin RG. J. Am. Chem. Soc. 1994;116:10178–10181.
-
- Lansbury PT, Costa PR, Griffiths JM, Simon EJ, Auger M, Halverson KJ, Kocisko DA, Hendsch ZS, Ashburn TT, Spencer RGS, Tidor B, Griffin RG. Nat. Struct. Biol. 1995;2:990–997. - PubMed
-
- McDermott AE. Curr. Opin. Struct. Biol. 2004;14:554–561. - PubMed
Publication types
MeSH terms
Substances
Grants and funding
LinkOut - more resources
Full Text Sources
Other Literature Sources