Review
. 2010 Jun;13(2):135-47.
doi: 10.1007/s10456-010-9168-y. Epub 2010 May 8.

'In vivo' optical approaches to angiogenesis imaging

Affiliations
Review

'In vivo' optical approaches to angiogenesis imaging

T J A Snoeks et al. Angiogenesis. 2010 Jun.

Abstract

In recent years, molecular imaging gained significant importance in biomedical research. Optical imaging developed into a modality which enables the visualization and quantification of all kinds of cellular processes and cancerous cell growth in small animals. Novel gene reporter mice and cell lines and the development of targeted and cleavable fluorescent "smart" probes form a powerful imaging toolbox. The development of systems collecting tomographic bioluminescence and fluorescence data enabled even more spatial accuracy and more quantitative measurements. Here we describe various bioluminescent and fluorescent gene reporter models and probes that can be used to specifically image and quantify neovascularization or the angiogenic process itself.


Figures
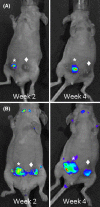
Fig. 1
Fig. 1
Multi-modality imaging of tumor growth and angiogenesis. A VEGFR2-luc knock-in mouse was orthotopically, i.e., in the mammary fat pad, inoculated with 1 × 106 SMF-mCherry cells (marked with asterisk) and SMF wild-type cells (marked with filled diamond), a murine breast cancer cell line. SMF-mCherry cells constitutively express the far red fluorescent protein mCherry, which accumulates in the cytoplasm. Mice were imaged at week 2 and week 4 both FLI (a) and BLI (b) using the IVIS Spectrum (Caliper LifeSciences, USA) camera system. a Tumor growth of the mCherry positive tumor could be followed over time using FLI. b The BLI signal was present at the site of both the mCherry positive and negative tumors indicating a local upregulation of VEGFR2 expression and tumor angiogenesis. (Snoeks et al. unpubl. results)
Fig. 2
Fig. 2
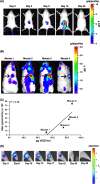
Induction of fl expression during wound healing in a pVEGF-TSTA-fl transgenic mouse. a mouse was imaged before wound creation in the CCD camera (day 0) and imaged again subsequent to wound creation every 4–5 days using d-luciferin (150 mg/kg ip). b Optical CCD images of four pVEGF-TSTA-fl transgenic mice (mice 1–4) on days 19, 20, 21, and 22 after creation of the wound. Arrows indicate the position of the wounds. c Correlation plot of maximum bioluminescence signal (p·s−1·cm−2·sr−1) vs. endogenous VEGF levels in the wound tissue (r 2 = 0.70). Error bars represent the standard error for triplicate samples in the ELISA assay. (d) pVEGF-TSTA-fl transgenic mice were injected subcutaneously with 5 × 106 NK2 (FVB/N mouse mammary tumor cell line) cells in the lower right flank. Mice were imaged on day 4 and subsequently every few days until day 29 using d-luciferin as the reporter substrate (150 mg/kg, injected ip). CCD camera imaging revealed a detectable bioluminescence signal in the area around the tumor on day 4. Signal intensity continued to increase until day 17, after which a considerable decline in signal was observed (days 22–29). (Adapted with permission from Wang et al. Physiol Genomics. 2006 Jan 12; 24(2):173–80. [35])
Fig. 3
Fig. 3
GFP vessels in the athymic Tie2-GFP transgenic adult mouse. ag Images from heart, kidney, liver, spleen, lung, brain, and calf muscle, respectively. Scale bar represents 20 μm. hj Intr. avital fluorescence microscopy images of GFP vessels in the muscle (hi) and in the ear skin (j). (Reprinted from Hillen F, Kaijzel EL, Castermans K, oude Egbrink MG, Lowik CW, Griffioen AW. A transgenic Tie2-GFP athymic mouse model; a tool for vascular biology in xenograft tumors. Biochem Biophys Res Commun 2008; 368:364–7. [37])
Fig. 4
Fig. 4
In vivo fluorescent microscopy of tumor vasculature. An eNOS-GFP mouse received a subcutaneous inoculation with 1 × 106 SMF-mCherry cells in a dorsal skinfold chamber. Images were taken using a Zeiss CLSM 510 Meta microscope with a 10× objective. The following excitation lasers and emission filters were used, green: laser 488 nm, filter BP 505–550 nm, red: laser 543 nm, filter BP 560–615 nm. a Green fluorescent vasculature. b Red fluorescent tumorcells. c Superimposed images of the vasculature and tumorcells (Kaijzel, Ten Hagen et al. unpubl. results)
Fig. 5
Fig. 5
In vivo monitoring of the stabilization of HIF-1α using bioluminescence imaging. a pcDNA3.1-mHIF-1α-luciferase (HIF-1α-luc) and pcDNA3.1-luciferase (luciferase) reporter constructs. b Immunofluorescence staining of firefly luciferase in MEF cells transiently transfected with pcDNA3.1-mHIF-1α-luciferase. Nuclei were stained with DAPI. (Magnification: × 300.) c Assessment of oxygen-dependent regulation and transcriptional activity of the HIF-1α-luciferase fusion construct. MEF-Hif1a +/+ or MEF-Hif1a −/− were cotransfected with pcDNA3.1 mHIF-1α-luciferase, and the reporter plasmid pH3SVB, which drives the expression of β-galactosidase from a HIF responsive promoter. β-Galactosidase activity was assessed. Data are representative of 2 independent experiments. d Bioluminescent images of a mouse carrying a HIF-1α-luciferase C51 tumor in the neck. Four consecutive images of the same animal are shown. Color bar indicates total photon counts. e Normalized bioluminescence photon counts (mean ± SEM) relative to day 5 values for both the HIF1α-luciferase and the luciferase control tumors. Values indicated by asterisk significantly (P ≤ 0.05) differ from values measured in control groups. (Adapted with permission from Lehmann et al. Proc Natl Acad Sci USA. 2009 Aug 18; 106(33):14004–9. Epub 2009 Jul 31. [61])
Fig. 6
Fig. 6
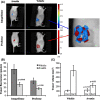
Effect of antiangiogenic Avastin treatment on αvβ3 integrin and cathepsin B signals in A673 tumor-bearing mice. a Representative volume renderings of IntegriSense and ProSense. Note the differential localization of fluorescent signal with IntegriSense and ProSense in the same animals (IntegriSense in blue and ProSense in red). b Quantification of tumor fluorescence shows that IntegriSense and Prosense signal in tumors is decreased following Avastin treatment (P = 0.0008 and P = 0.013, respectively). c Avastin also significantly inhibits tumor growth as determined by tumor volume calipers measurements (by 58.4%, P = 0.022). (Reprinted from Kossodo S, Pickarski M, Lin SA, Gleason A, Gaspar R, Buono C, Ho G, Blusztajn A, Cuneo G, Zhang J, Jensen J, Hargreaves R, Coleman P, Hartman G, Rajopadhye M, Duong LT, Sur C, Yared W, Peterson J, Bednar B. Dual In Vivo Quantification of Integrin-targeted and Protease-activated Agents in Cancer Using Fluorescence Molecular Tomography (FMT). Mol Imaging Biol 2009. [87])
Fig. 7
Fig. 7
Dual target imaging. Mice bearing xenograft tumors (either breast cancers or gliosarcomas) were imaged at two different wavelengths to map angiogenesis (a 748 nm) and HER-2/neu (b 672 nm) in the same animal. The gliosarcoma is largely devoid of HER-2/neu. c a combined three-dimensional map of both processes. (Adapted with permission from Montet et al. Cancer Res. 2005 Jul 15; 65(14):6330–6. Fig. 4 [95])

Similar articles

Cited by

References

    1. Contag CH, Bachmann MH. Advances in in vivo bioluminescence imaging of gene expression. Annu Rev Biomed Eng. 2002;4:235–260. doi: 10.1146/annurev.bioeng.4.111901.093336. - DOI - PubMed
    1. Bhaumik S, Gambhir SS. Optical imaging of Renilla luciferase reporter gene expression in living mice. Proc Natl Acad Sci USA. 2002;99:377–382. doi: 10.1073/pnas.012611099. - DOI - PMC - PubMed
    1. Hastings JW. Chemistries and colors of bioluminescent reactions: a review. Gene. 1996;173:5–11. doi: 10.1016/0378-1119(95)00676-1. - DOI - PubMed
    1. Pichler A, Prior JL, Piwnica-Worms D. Imaging reversal of multidrug resistance in living mice with bioluminescence: MDR1 P-glycoprotein transports coelenterazine. Proc Natl Acad Sci USA. 2004;101:1702–1707. doi: 10.1073/pnas.0304326101. - DOI - PMC - PubMed
    1. Tannous BA, Kim DE, Fernandez JL, Weissleder R, Breakefield XO. Codon-optimized Gaussia luciferase cDNA for mammalian gene expression in culture and in vivo. Mol Ther. 2005;11:435–443. doi: 10.1016/j.ymthe.2004.10.016. - DOI - PubMed

Publication types

Substances