Single point vs. mapping approach for spectral cytopathology (SCP)
- PMID: 20449833
- PMCID: PMC3076557
- DOI: 10.1002/jbio.201000023
Single point vs. mapping approach for spectral cytopathology (SCP)
Abstract
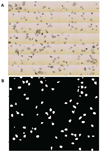
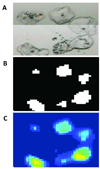
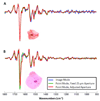
In this paper we describe the advantages of collecting infrared microspectral data in imaging mode opposed to point mode. Imaging data are processed using the PapMap algorithm, which co-adds pixel spectra that have been scrutinized for R-Mie scattering effects as well as other constraints. The signal-to-noise quality of PapMap spectra will be compared to point spectra for oral mucosa cells deposited onto low-e slides. Also the effects of software atmospheric correction will be discussed. Combined with the PapMap algorithm, data collection in imaging mode proves to be a superior method for spectral cytopathology.
(c) 2010 WILEY-VCH Verlag GmbH & Co. KGaA, Weinheim.
Figures


Similar articles
-
RMieS-EMSC correction for infrared spectra of biological cells: extension using full Mie theory and GPU computing.J Biophotonics. 2010 Aug;3(8-9):609-20. doi: 10.1002/jbio.201000036. J Biophotonics. 2010. PMID: 20414907
-
Spectral cytopathology of cervical samples: detecting cellular abnormalities in cytologically normal cells.Lab Invest. 2010 Jul;90(7):1068-77. doi: 10.1038/labinvest.2010.72. Epub 2010 Apr 5. Lab Invest. 2010. PMID: 20368702 Free PMC article.
-
Two step resonant Mie scattering correction of infrared micro-spectral data: human lymph node tissue.J Biophotonics. 2010 Aug;3(8-9):597-608. doi: 10.1002/jbio.201000024. J Biophotonics. 2010. PMID: 20437419
-
Cancer screening via infrared spectral cytopathology (SCP): results for the upper respiratory and digestive tracts.Analyst. 2016 Jan 21;141(2):416-28. doi: 10.1039/c5an01751c. Analyst. 2016. PMID: 26421636 Review.
-
Biological applications of synchrotron radiation infrared spectromicroscopy.Biotechnol Adv. 2012 Nov-Dec;30(6):1390-404. doi: 10.1016/j.biotechadv.2012.02.012. Epub 2012 Feb 28. Biotechnol Adv. 2012. PMID: 22401782 Review.
Cited by
-
Using Fourier transform IR spectroscopy to analyze biological materials.Nat Protoc. 2014 Aug;9(8):1771-91. doi: 10.1038/nprot.2014.110. Epub 2014 Jul 3. Nat Protoc. 2014. PMID: 24992094 Free PMC article.
-
Evaluating different fixation protocols for spectral cytopathology, part 1.Anal Chem. 2012 Feb 7;84(3):1259-66. doi: 10.1021/ac202046d. Epub 2012 Jan 24. Anal Chem. 2012. PMID: 22103764 Free PMC article.
-
Cell Phase Identification in a Three-Dimensional Engineered Tumor Model by Infrared Spectroscopic Imaging.Anal Chem. 2023 Feb 14;95(6):3349-3357. doi: 10.1021/acs.analchem.2c04554. Epub 2022 Dec 27. Anal Chem. 2023. PMID: 36574385 Free PMC article.
-
Evaluating different fixation protocols for spectral cytopathology, part 2: cultured cells.Anal Chem. 2012 Oct 2;84(19):8265-71. doi: 10.1021/ac3017407. Epub 2012 Sep 11. Anal Chem. 2012. PMID: 22935013 Free PMC article.
References
-
- Papanicolaou GN, Traut H. The diagnostic value of vaginal smears in carcinoma of the uterus. Am J Obstet Gynecol. 1941;42:193–206. - PubMed
-
- Papanicolaou GN. New Cancer Diagnosis. Proceedings of the Third Race Betterment C. 1928:528.
-
- Stoler MH, Schiffman M. Interobserver Reproducibility of Cervical Cytologic and Histologic Interpretations. JAMA. 2001;285:1500–1505. - PubMed
-
- Brink AATP, Zielinski GD, Steenbergen RDM, Snijders PJF, Meijer CJLM. Clinical relevance of human papillomavirus testing in cytopathology. Cytopathology. 2005;16:7–12. - PubMed
Publication types
MeSH terms
Grants and funding
LinkOut - more resources
Full Text Sources

