

Foxo1 regulates marginal zone B-cell development
- PMID: 20449867
- PMCID: PMC2926184
- DOI: 10.1002/eji.200939817
Foxo1 regulates marginal zone B-cell development
Abstract
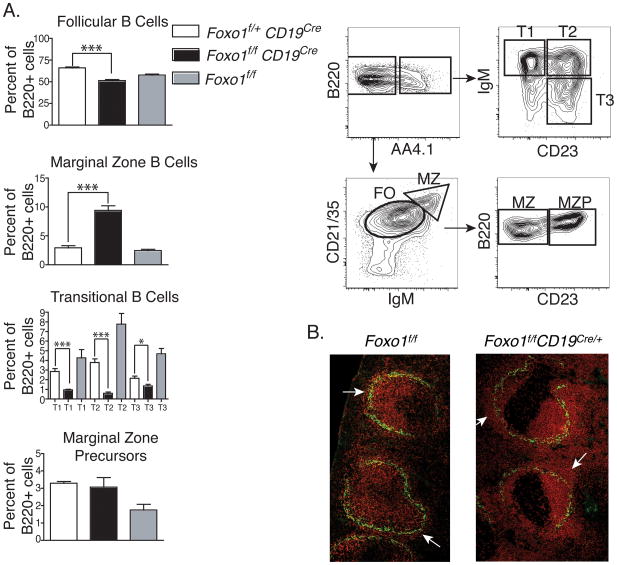
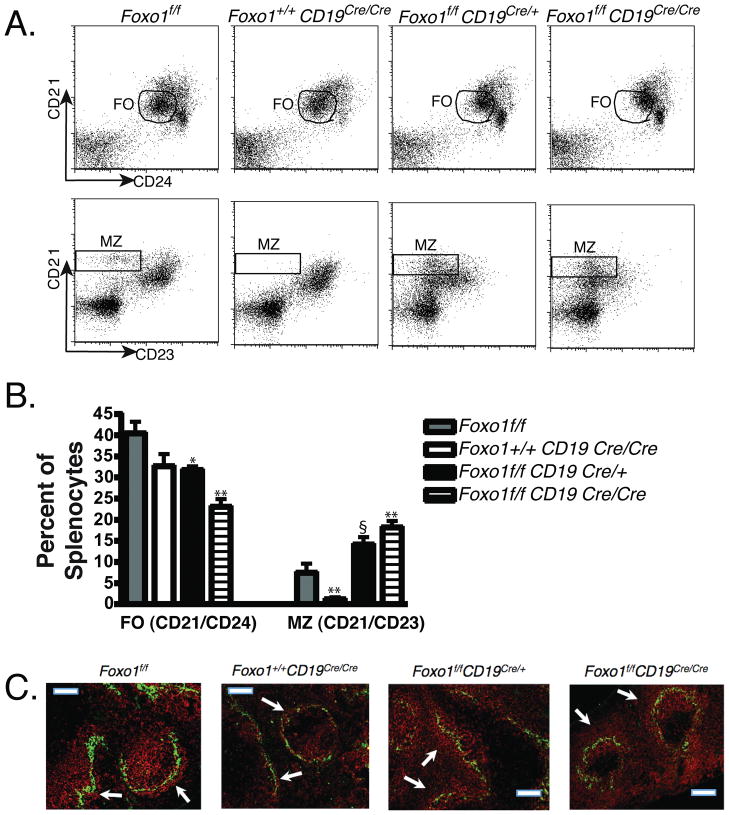
A fundamental component of signaling initiated by the BCR and CD19 is the activation of phosphoinositide 3-kinase. Downstream of phosphoinositide 3-kinase, the protein kinase AKT phosphorylates several substrates, including members of the forkhead box subgroup O (Foxo) transcription factor family. Among the Foxo proteins, Foxo1 has unique functions in bone marrow B-cell development and peripheral B-cell function. Here, we report a previously unrecognized role for Foxo1 in controlling the ratio of mature B-cell subsets in the spleen. Conditional deletion of Foxo1 in B cells resulted in an increased percentage of marginal zone B cells and a decrease in follicular (FO) B cells. In addition, Foxo1 deficiency corrected the absence of marginal zone B cells that occurs in CD19-deficient mice. These findings show that Foxo1 regulates the balance of mature B-cell subsets and is required for the marginal zone B-cell deficiency phenotype of mice lacking CD19.
Conflict of interest statement
The authors declare no financial or commercial conflict of interest.
Figures
Similar articles
-
Foxo3-/- mice demonstrate reduced numbers of pre-B and recirculating B cells but normal splenic B cell sub-population distribution.Int Immunol. 2009 Jul;21(7):831-42. doi: 10.1093/intimm/dxp049. Epub 2009 Jun 5. Int Immunol. 2009. PMID: 19502585 Free PMC article.
-
CD19 regulates ADAM28-mediated Notch2 cleavage to control the differentiation of marginal zone precursors to MZ B cells.J Cell Mol Med. 2017 Dec;21(12):3658-3669. doi: 10.1111/jcmm.13276. Epub 2017 Jul 14. J Cell Mol Med. 2017. PMID: 28707394 Free PMC article.
-
A global network of transcription factors, involving E2A, EBF1 and Foxo1, that orchestrates B cell fate.Nat Immunol. 2010 Jul;11(7):635-43. doi: 10.1038/ni.1891. Epub 2010 Jun 13. Nat Immunol. 2010. PMID: 20543837 Free PMC article.
-
FOXO1 transcription factor: a critical effector of the PI3K-AKT axis in B-cell development.Int Rev Immunol. 2014 Mar;33(2):146-57. doi: 10.3109/08830185.2014.885022. Epub 2014 Feb 20. Int Rev Immunol. 2014. PMID: 24552152 Review.
-
The Role of Forkhead Box 1 (FOXO1) in the Immune System: Dendritic Cells, T Cells, B Cells, and Hematopoietic Stem Cells.Crit Rev Immunol. 2017;37(1):1-13. doi: 10.1615/CritRevImmunol.2017019636. Crit Rev Immunol. 2017. PMID: 29431075 Free PMC article. Review.
Cited by
-
Emergence of the PI3-kinase pathway as a central modulator of normal and aberrant B cell differentiation.Curr Opin Immunol. 2011 Apr;23(2):178-83. doi: 10.1016/j.coi.2011.01.001. Epub 2011 Feb 1. Curr Opin Immunol. 2011. PMID: 21277760 Free PMC article. Review.
-
Akt and mTOR in B Cell Activation and Differentiation.Front Immunol. 2012 Aug 6;3:228. doi: 10.3389/fimmu.2012.00228. eCollection 2012. Front Immunol. 2012. PMID: 22888331 Free PMC article.
-
Selective inhibitors of phosphoinositide 3-kinase delta: modulators of B-cell function with potential for treating autoimmune inflammatory diseases and B-cell malignancies.Front Immunol. 2012 Aug 23;3:256. doi: 10.3389/fimmu.2012.00256. eCollection 2012. Front Immunol. 2012. PMID: 22936933 Free PMC article.
-
Active PI3K abrogates central tolerance in high-avidity autoreactive B cells.J Exp Med. 2019 May 6;216(5):1135-1153. doi: 10.1084/jem.20181652. Epub 2019 Apr 4. J Exp Med. 2019. PMID: 30948496 Free PMC article.
-
Mutations in the transcription factor FOXO1 mimic positive selection signals to promote germinal center B cell expansion and lymphomagenesis.Immunity. 2021 Aug 10;54(8):1807-1824.e14. doi: 10.1016/j.immuni.2021.07.009. Immunity. 2021. PMID: 34380064 Free PMC article.
References
-
- Fruman DA, Bismuth G. Fine tuning the immune response with PI3K. Immunol Rev. 2009;228:253–272. - PubMed
-
- Carter RH, Wang Y, Brooks S. Role of CD19 signal transduction in B cell biology. Immunol Res. 2002;26:45–54. - PubMed
-
- Del Nagro CJ, Otero DC, Anzelon AN, Omori SA, Kolla RV, Rickert RC. CD19 function in central and peripheral B-cell development. Immunol Res. 2005;31:119–131. - PubMed
-
- Depoil D, Fleire S, Treanor BL, Weber M, Harwood NE, Marchbank KL, Tybulewicz VL, Batista FD. CD19 is essential for B cell activation by promoting B cell receptor-antigen microcluster formation in response to membrane-bound ligand. Nat Immunol. 2008;9:63–72. - PubMed
-
- Wang Y, Brooks SR, Li X, Anzelon AN, Rickert RC, Carter RH. The physiologic role of CD19 cytoplasmic tyrosines. Immunity. 2002;17:501–514. - PubMed
Publication types
MeSH terms
Substances
Grants and funding
LinkOut - more resources
Full Text Sources
Molecular Biology Databases
Research Materials
Miscellaneous
