

Temporal trends in highly active antiretroviral therapy initiation among injection drug users in Baltimore, Maryland, 1996-2008
- PMID: 20450418
- PMCID: PMC2874101
- DOI: 10.1086/652867
Temporal trends in highly active antiretroviral therapy initiation among injection drug users in Baltimore, Maryland, 1996-2008
Abstract
Background: We characterized temporal trends in highly active antiretroviral therapy (HAART) initiation (1996-2008) among treatment-eligible persons in a community-based cohort of current and former injection drug users (IDUs) in Baltimore, Maryland.
Methods: The AIDS Linked to the IntraVenous Experience (ALIVE) cohort has been observing human immunodeficiency virus (HIV)-positive IDUs since 1988. HAART eligibility was defined as the first visit after 1 January 1996 at which the patient's CD4(+) cell count was <350 cells/microL. Temporal trends and predictors of HAART initiation were examined using chi(2) tests for trend and lognormal survival models.
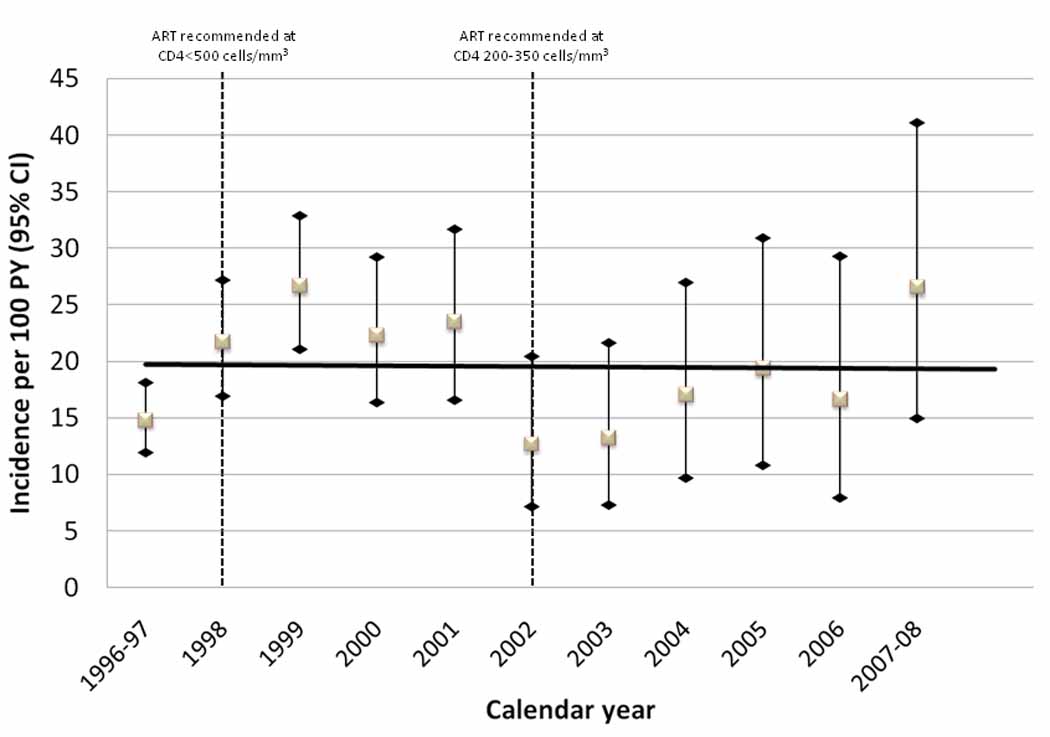
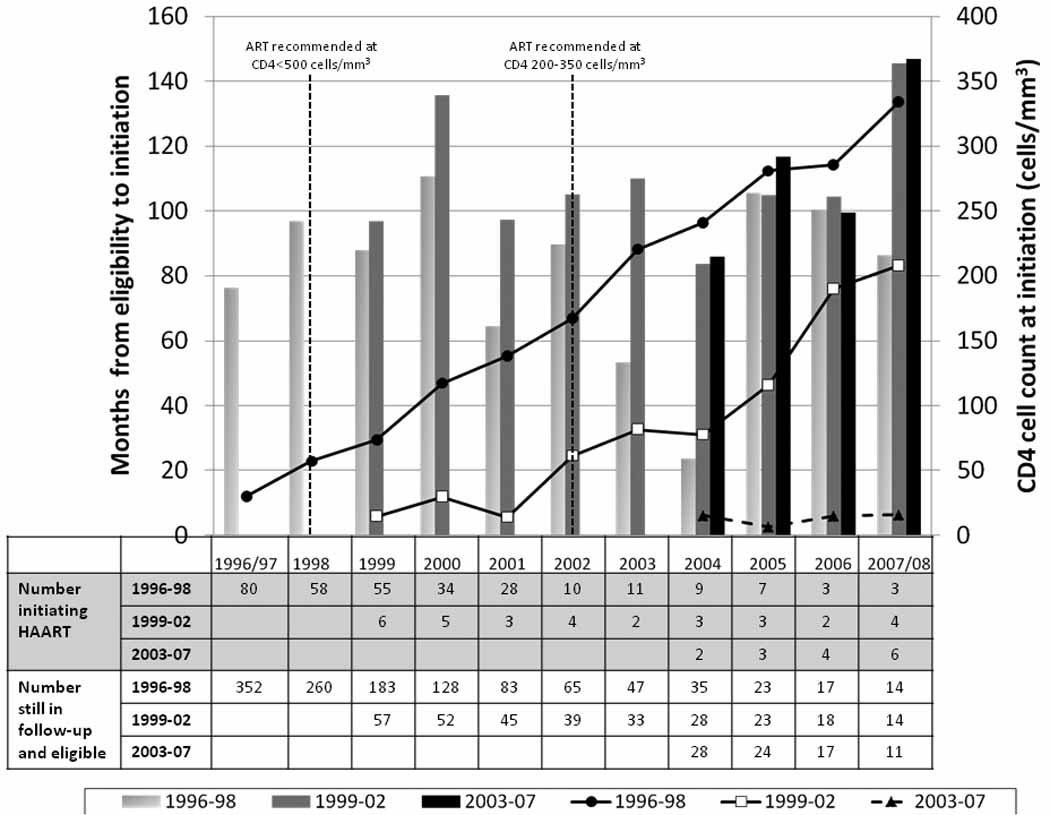
Results: The median age of 582 HAART-eligible IDUs was 41 years; 75% of the subjects were male, 97% were African American, and 60% were active IDUs. Of these 582 individuals, 345 initiated HAART over 1803 person-years (19.2 subjects per 100 person-years; 95% confidence interval, 17.2-21.3 subjects per 100 person-years); there was no statistically significant temporal trend in HAART initiation. Independent predictors of delayed initiation included heavy injection drug use; having a prior AIDS diagnosis, having a lower CD4(+) cell count, having a usual source of care, and having health insurance were predictors of more-rapid initiation. The delay between eligibility and initiation decreased among those who became eligible most recently (2003-2007), compared with those in earlier periods (1996-2002); however, a substantial number of patients who became eligible in recent years either initiated HAART after a substantial delay or did not initiate HAART at all.
Conclusions: We failed to observe substantial improvement in HAART initiation among current and former IDUs over a 12-year period; heavy use of injection drugs remains the major barrier to HAART initiation and to consistent HIV care. The fact that many IDUs initiate HAART after a significant delay or do not initiate it at all raises concern that disparities in HIV care for IDUs remain at a time of simplified antiretroviral regimens and increasing adoption of earlier treatment.
Conflict of interest statement
Figures
Similar articles
-
Time to initiating highly active antiretroviral therapy among HIV-infected injection drug users.AIDS. 2001 Sep 7;15(13):1707-15. doi: 10.1097/00002030-200109070-00015. AIDS. 2001. PMID: 11546947
-
Changes in sexual and drug-related risk behavior following antiretroviral therapy initiation among HIV-infected injection drug users.AIDS. 2012 Nov 28;26(18):2383-91. doi: 10.1097/QAD.0b013e32835ad438. AIDS. 2012. PMID: 23079804 Free PMC article.
-
Poorer physical health-related quality of life among Aboriginals and injection drug users treated with highly active antiretroviral therapy.Can J Public Health. 2012 Nov 8;104(1):e33-8. doi: 10.1007/BF03405651. Can J Public Health. 2012. PMID: 23618106 Free PMC article.
-
Use of highly active antiretroviral therapy is increasing in HIV positive severe drug users.Curr HIV Res. 2010 Dec;8(8):641-8. doi: 10.2174/157016210794088272. Curr HIV Res. 2010. PMID: 21187006
-
HIV treatment as prevention among injection drug users.Curr Opin HIV AIDS. 2012 Mar;7(2):151-6. doi: 10.1097/COH.0b013e32834f9927. Curr Opin HIV AIDS. 2012. PMID: 22227587 Review.
Cited by
-
Unmet health care needs and hepatitis C infection among persons who inject drugs in Denver and Seattle, 2009.Prev Sci. 2015 Feb;16(2):330-40. doi: 10.1007/s11121-014-0500-4. Prev Sci. 2015. PMID: 24965910
-
Challenges in managing HIV in people who use drugs.Curr Opin Infect Dis. 2015 Feb;28(1):10-6. doi: 10.1097/QCO.0000000000000125. Curr Opin Infect Dis. 2015. PMID: 25490106 Free PMC article. Review.
-
Comprehensive Approaches to the Diagnosis and Treatment of HIV Infection in the Community: Can "Seek and Treat" Really Deliver?Curr Infect Dis Rep. 2011 Feb;13(1):68-74. doi: 10.1007/s11908-010-0151-y. Curr Infect Dis Rep. 2011. PMID: 21308457
-
Baltimore oral epidemiology, disease effects, and HIV evaluation study (BEEHIVE) study protocol: a prospective cohort study.BMC Oral Health. 2024 Apr 10;24(1):439. doi: 10.1186/s12903-024-04200-1. BMC Oral Health. 2024. PMID: 38600460 Free PMC article.
-
Increases in CD4+ T-cell count at antiretroviral therapy initiation among HIV-positive illicit drug users during a treatment-as-prevention initiative in Canada.Antivir Ther. 2017;22(5):403-411. doi: 10.3851/IMP3145. Epub 2017 Feb 24. Antivir Ther. 2017. PMID: 28234234 Free PMC article.
References
-
- Mocroft A, Vella S, Benfield TL, et al. EuroSIDA Study Group. Changing patterns of mortality across Europe in patients infected with HIV-1. Lancet. 1998;352:1725–1730. - PubMed
-
- Palella FJ, Jr., Delaney KM, Moorman AC, et al. Declining morbidity and mortality among patients with advanced human immunodeficiency virus infection. HIV Outpatient Study Investigators. N Engl J Med. 1998;338:853–860. - PubMed
-
- Walensky RP, Paltiel AD, Losina E, et al. The survival benefits of AIDS treatment in the United States. J Infect Dis. 2006;194:11–19. - PubMed
-
- Mocroft A, Phillips AN, Gatell J, et al. Normalisation of CD4 counts in patients with HIV-1 infection and maximum virological suppression who are taking combination antiretroviral therapy: an observational cohort study. Lancet. 2007;370:407–413. - PubMed
Publication types
MeSH terms
Grants and funding
LinkOut - more resources
Full Text Sources
Medical
Research Materials
