. 2010 Oct;43(5):669-85.
doi: 10.1016/j.jbi.2010.04.009. Epub 2010 May 5.

Learning patient-specific predictive models from clinical data

Affiliations

Learning patient-specific predictive models from clinical data

Shyam Visweswaran et al. J Biomed Inform. 2010 Oct.

Abstract

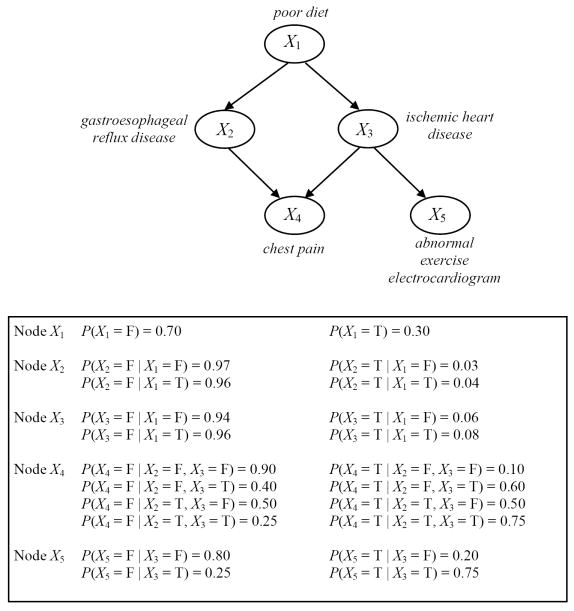
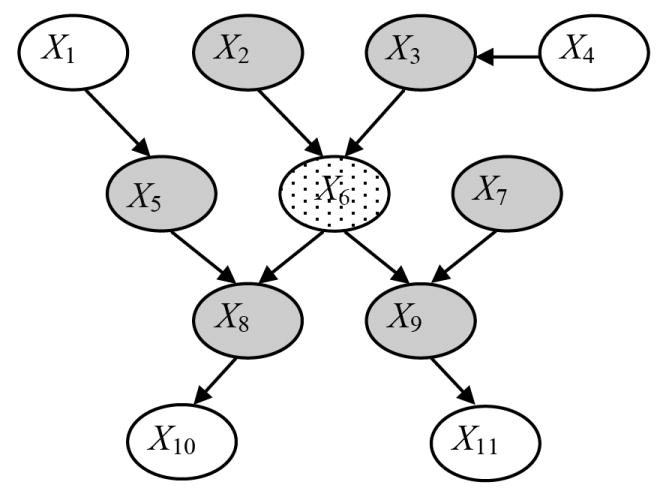
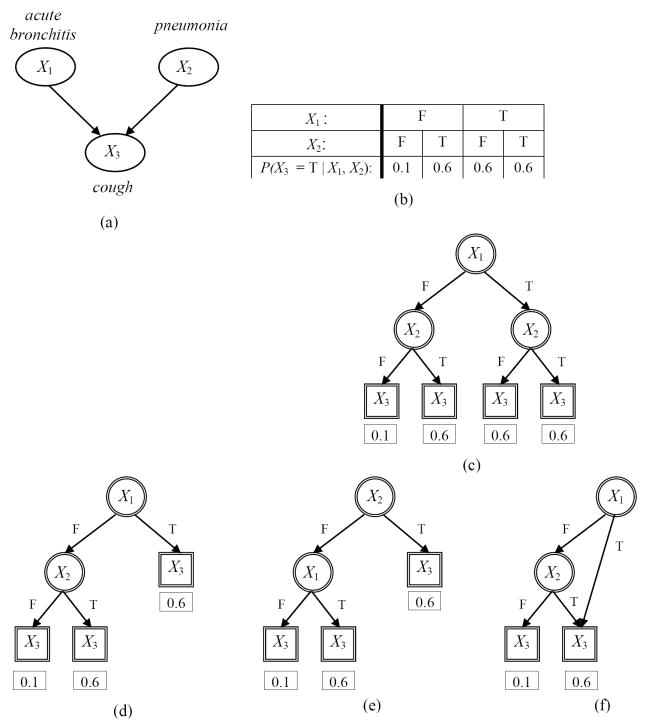
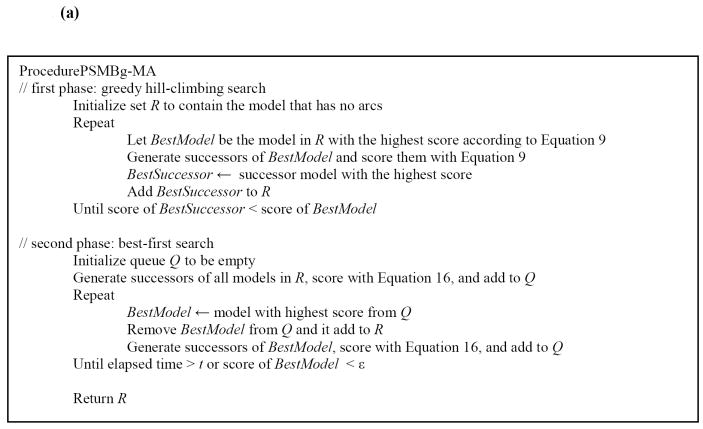
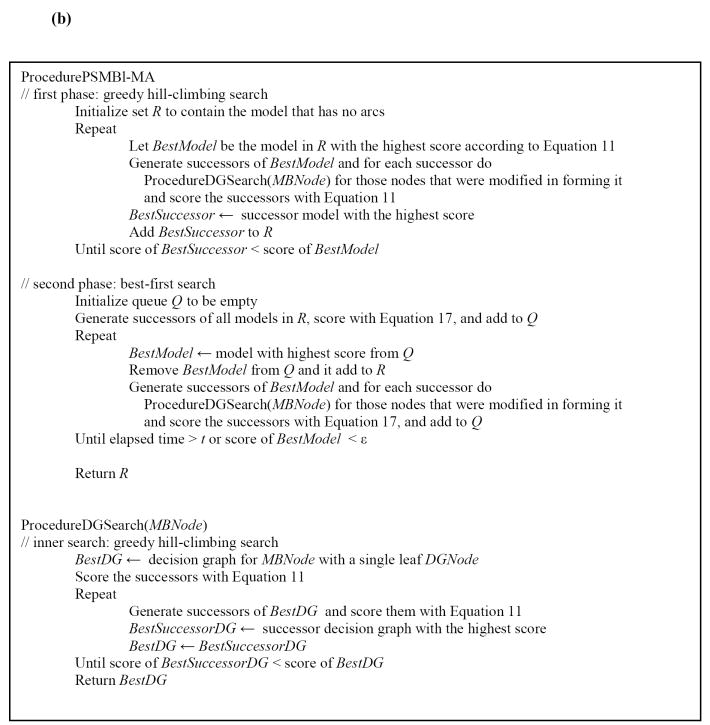
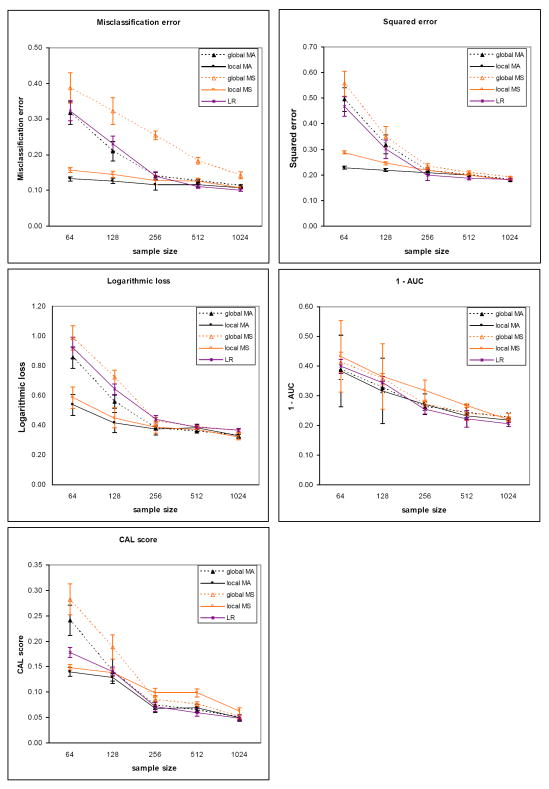
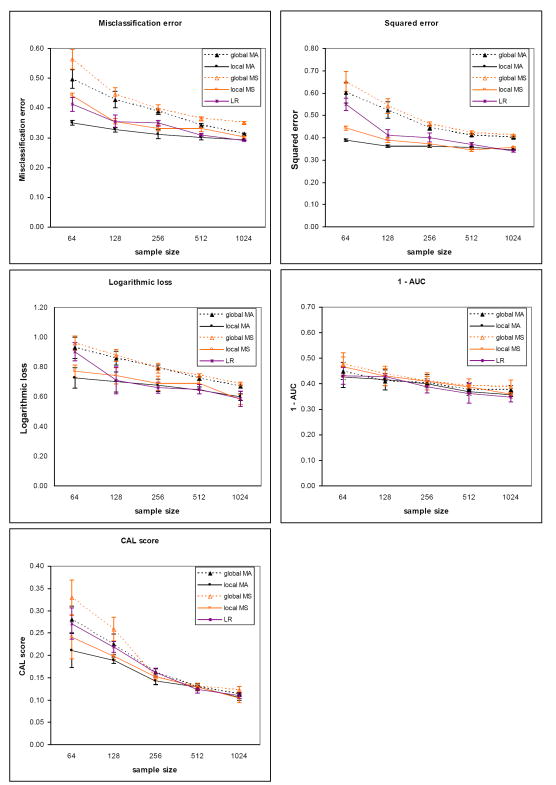
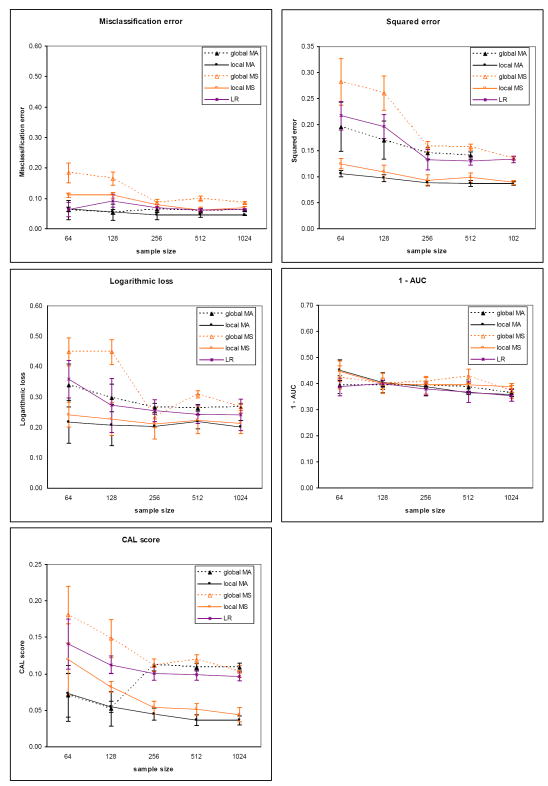
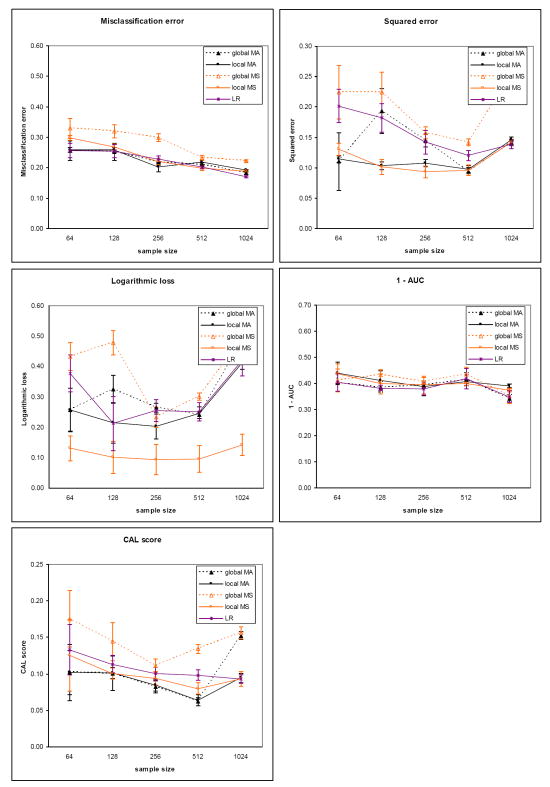
We introduce an algorithm for learning patient-specific models from clinical data to predict outcomes. Patient-specific models are influenced by the particular history, symptoms, laboratory results, and other features of the patient case at hand, in contrast to the commonly used population-wide models that are constructed to perform well on average on all future cases. The patient-specific algorithm uses Markov blanket (MB) models, carries out Bayesian model averaging over a set of models to predict the outcome for the patient case at hand, and employs a patient-specific heuristic to locate a set of suitable models to average over. We evaluate the utility of using a local structure representation for the conditional probability distributions in the MB models that captures additional independence relations among the variables compared to the typically used representation that captures only the global structure among the variables. In addition, we compare the performance of Bayesian model averaging to that of model selection. The patient-specific algorithm and its variants were evaluated on two clinical datasets for two outcomes. Our results provide support that the performance of an algorithm for learning patient-specific models can be improved by using a local structure representation for MB models and by performing Bayesian model averaging.


Figures

Figure 1
Figure 1
A simple hypothetical BN for a medical domain. All the nodes represent binary variables, taking values in the domain {T, F} where T stands for True and F for False. The graph at the top represents the BN structure. Associated with each variable (node) is a conditional probability table representing the probability of each variable’s value conditioned on its parent set. (Note that these probabilities are for illustration only; they are not intended to reflect the frequency of events in any actual patient population.)
Figure 2
Figure 2
Example of a Markov blanket within a BN. The minimal Markov blanket of the node X6 (shown stippled) consists of the set of parents (X2 and X3), children (X8 and X9), and parents of the children (X5 and X7) of that node, as indicated by the shaded nodes. Nodes X1, X4, X10 and X11 are not in the minimal Markov blanket of X6.
Figure 3
Figure 3
Examples of CPD representations for a small hypothetical BN where all nodes represent binary variables taking values in the domain {T, F} where T stands for True and F for False. Several CPD representations for the BN node X3 (cough) in panel (a) are shown in subsequent panels. Panel (b) shows a CPT in a standard BN for the node X3 with four parameters (only the values for P(X3 = T ∣ X1, X2) are shown). The CPT can be equivalently represented by a complete decision tree as shown in panel (c). Panels (d) and (e) show alternate decision trees where each one captures one of the two context specific independence relations that is present but not both (see text for details). Panel (f) shows a decision graph that captures both the context specific independence relations (see text for details). Nodes of a BN are shown as ellipses with single lines while nodes of decision trees and decision graphs are shown as either circles with double lines (interior nodes) or as rectangles with double lines (leaf nodes). The values for P(X3 = T ∣ X1, X2) are shown under each leaf node.
Figure 4
Figure 4
(a) High level pseudocode for the two-phase search procedure used by the PSMBg-MA algorithm. (b) High level pseudocode for the two-phase outer search procedure and the inner search procedure used by the PSMBl-MA algorithm. The PSMBl-MA algorithm differs from the PSMBg-MA algorithm in that invokes ProcedureDGSearch for the inner search to identify a local decision graph for each node modified in the MB structure by the outer search procedure. Note that MBNode is a node in the MB structure while DGNode is a node in a decision graph.
Figure 4
Figure 4
(a) High level pseudocode for the two-phase search procedure used by the PSMBg-MA algorithm. (b) High level pseudocode for the two-phase outer search procedure and the inner search procedure used by the PSMBl-MA algorithm. The PSMBl-MA algorithm differs from the PSMBg-MA algorithm in that invokes ProcedureDGSearch for the inner search to identify a local decision graph for each node modified in the MB structure by the outer search procedure. Note that MBNode is a node in the MB structure while DGNode is a node in a decision graph.
Figure 5
Figure 5
Sepsis dataset results for the outcome death. Plots show the mean classification error, mean squared error, mean logarithmic loss, mean 1-AUC and mean CAL score of the patient-specific model averaging algorithms vs. model selection versions of these algorithms. For all performance measures lower is better. The sizes of the training dataset vary from 64 to 1024 patient cases. The plots in the solid lines are for the PSMBl-MA (local MA) and the PSMBl-MS (local MS) algorithms; plots in the broken lines are for the PSMBg-MA (global MA) and the PSMBg-MA (global MS) algorithms; and plots in the dotted lines are for logistic regression (LR). The error bars represent one standard deviation.
Figure 6
Figure 6
Sepsis dataset results for the outcome severe sepsis. See the legend of Figure 5 for details.
Figure 7
Figure 7
Heart failure dataset results for the outcome death. The sizes of the training dataset vary from 64 to 4096 patient cases. See the legend caption of Figure 5 for details.
Figure 8
Figure 8
Heart failure dataset results for the outcome complications, which includes death. The sizes of the training dataset vary from 64 to 4096 patient cases. See the legend caption of Figure 5 for details.

References

    1. van Bemmel JH, Musen MA. Handbook of Medical Informatics. 1. New York: Springer-Verlag; 1997.
    1. Abu-Hanna A, Lucas PJ. Prognostic models in medicine. AI and statistical approaches. Methods of Information in Medicine. 2001 Mar;40(1):1–5. - PubMed
    1. Cooper GF, Aliferis CF, Ambrosino R, Aronis J, Buchanan BG, Caruana R, et al. An evaluation of machine-learning methods for predicting pneumonia mortality. Artificial Intelligence. 1997 Feb;9(2):107–38. - PubMed
    1. Hoeting JA, Madigan D, Raftery AE, Volinsky CT. Bayesian model averaging: A tutorial. Statistical Science. 1999 Nov;14(4):382–401.
    1. Visweswaran S. PhD dissertation. Pittsburgh: University of Pittsburgh; 2007. Learning patient-specific models from clinical data. [updated 2007; cited]; Available from: http://etd.library.pitt.edu/ETD/available/etd-11292007-232406/unrestrict....

Publication types