

Quality assessment of transcriptome data using intrinsic statistical properties
- PMID: 20451162
- PMCID: PMC5054119
- DOI: 10.1016/S1672-0229(10)60006-X
Quality assessment of transcriptome data using intrinsic statistical properties
Abstract
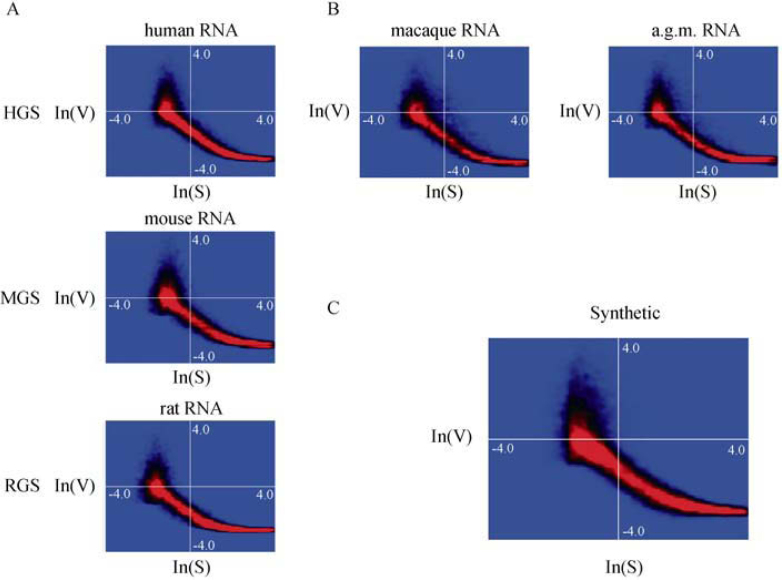
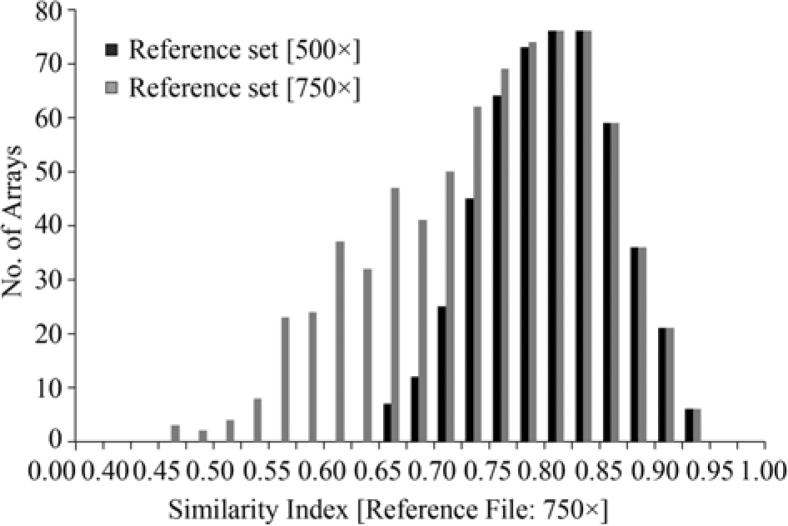
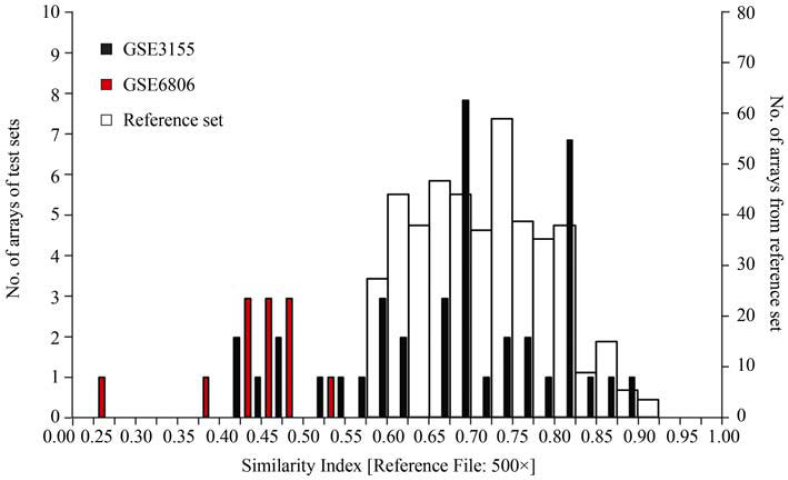
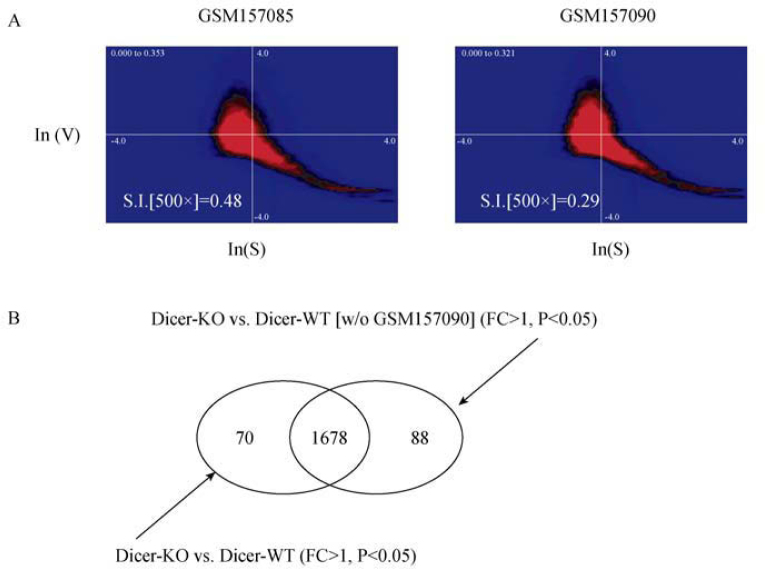
In view of potential application to biomedical diagnosis, tight transcriptome data quality control is compulsory. Usually, quality control is achieved using labeling and hybridization controls added at different stages throughout the processing of the biologic RNA samples. These control measures, however, only reflect the performance of the individual technical manipulations during the entire process and have no bearing as to the continued integrity of the RNA sample itself. Here we demonstrate that intrinsic statistical properties of the resulting transcriptome data signal and signal-variance distributions and their invariance can be identified independently of the animal species studied and the labeling protocol used. From these invariant properties we have developed a data model, the parameters of which can be estimated from individual experiments and used to compute relative quality measures based on similarity with large reference datasets. These quality measures add supplementary, non-redundant information to standard quality control estimates based on spike-in and hybridization controls, and are exploitable in data analysis. A software application for analyzing datasets as well as a reference dataset for AB1700 arrays are provided. They should allow AB1700 users to easily integrate this method into their analysis pipeline, and might instigate similar developments for other transcriptome platforms.
2010 Beijing Genomics Institute. Published by Elsevier Ltd. All rights reserved.
Figures
Similar articles
-
Cross-platform ultradeep transcriptomic profiling of human reference RNA samples by RNA-Seq.Sci Data. 2014 Aug 26;1:140020. doi: 10.1038/sdata.2014.20. eCollection 2014. Sci Data. 2014. PMID: 25977777 Free PMC article.
-
SPARTA: Simple Program for Automated reference-based bacterial RNA-seq Transcriptome Analysis.BMC Bioinformatics. 2016 Feb 4;17:66. doi: 10.1186/s12859-016-0923-y. BMC Bioinformatics. 2016. PMID: 26847232 Free PMC article.
-
Impact of RNA degradation on gene expression profiles: assessment of different methods to reliably determine RNA quality.J Biotechnol. 2007 Jan 20;127(4):549-59. doi: 10.1016/j.jbiotec.2006.07.032. Epub 2006 Aug 2. J Biotechnol. 2007. PMID: 16945445
-
[Transcriptomes for serial analysis of gene expression].J Soc Biol. 2002;196(4):303-7. J Soc Biol. 2002. PMID: 12645300 Review. French.
-
Current approaches and developments in transcript profiling of the human placenta.Hum Reprod Update. 2020 Nov 1;26(6):799-840. doi: 10.1093/humupd/dmaa028. Hum Reprod Update. 2020. PMID: 33043357 Free PMC article. Review.
Cited by
-
CTIP2 is a negative regulator of P-TEFb.Proc Natl Acad Sci U S A. 2013 Jul 30;110(31):12655-60. doi: 10.1073/pnas.1220136110. Epub 2013 Jul 12. Proc Natl Acad Sci U S A. 2013. PMID: 23852730 Free PMC article.
-
Retinoic acid receptor α as a novel contributor to adrenal cortex structure and function through interactions with Wnt and Vegfa signalling.Sci Rep. 2019 Oct 11;9(1):14677. doi: 10.1038/s41598-019-50988-2. Sci Rep. 2019. PMID: 31605007 Free PMC article.
-
BIM and NOXA are mitochondrial effectors of TAF6δ-driven apoptosis.Cell Death Dis. 2018 Jan 22;9(2):70. doi: 10.1038/s41419-017-0115-3. Cell Death Dis. 2018. PMID: 29358700 Free PMC article.
-
Alternative splicing of TAF6: downstream transcriptome impacts and upstream RNA splice control elements.PLoS One. 2014 Jul 15;9(7):e102399. doi: 10.1371/journal.pone.0102399. eCollection 2014. PLoS One. 2014. PMID: 25025302 Free PMC article.
-
Latent HIV-1 TAR Regulates 7SK-responsive P-TEFb Target Genes and Targets Cellular Immune Responses in the Absence of Tat.Genomics Proteomics Bioinformatics. 2017 Oct;15(5):313-323. doi: 10.1016/j.gpb.2017.05.003. Epub 2017 Oct 14. Genomics Proteomics Bioinformatics. 2017. PMID: 29037489 Free PMC article.
References
-
- Canales R.D. Evaluation of DNA microarray results with quantitative gene expression platforms. Nat. Biotechnol. 2006;24:1115–1122. - PubMed
-
- Patterson T.A. Performance comparison of one-color and two-color platforms within the MicroArray Quality Control (MAQC) project. Nat. Biotechnol. 2006;24:1140–1150. - PubMed
Publication types
MeSH terms
Substances
LinkOut - more resources
Full Text Sources
Other Literature Sources
